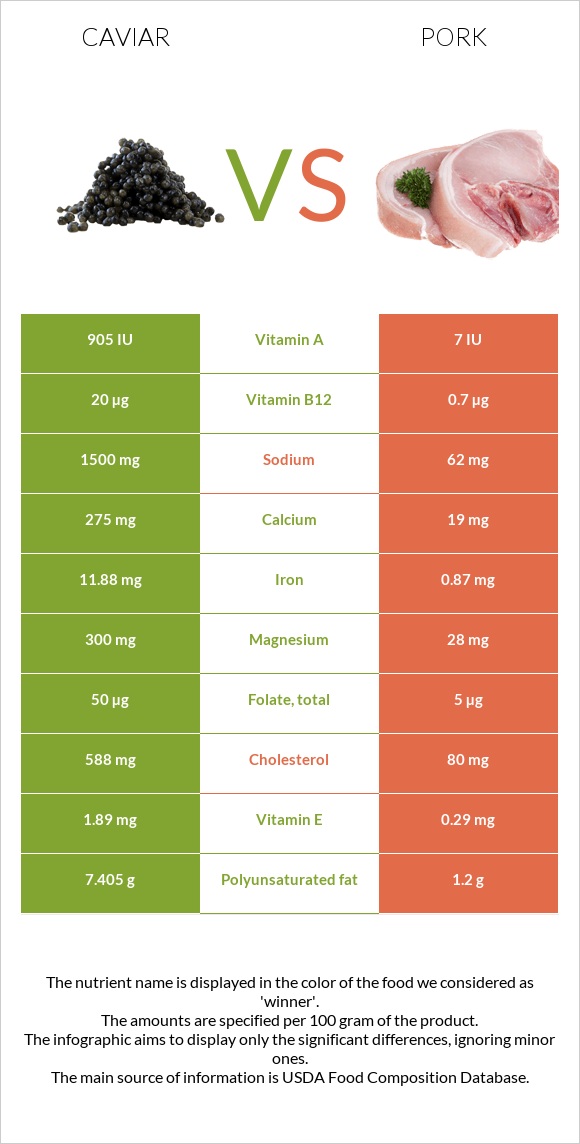
The main differences between caviar and pork Caviar has more vitamin B12, iron, choline, magnesium, vitamin B5, and selenium; however, pork has more vitamin B1 and vitamin B3. Daily need coverage for vitamin B12 for caviar is 804% higher. Pork has 24 times less sodium than caviar. Caviar has 1500mg of sodium, while pork has 62mg. Food types used in this article are Fish, caviar, black, and red, granular and Pork, fresh, loin, whole, separable lean, and fat, cooked, broiled .
Infographic
Mineral Comparison
Mineral comparison score is based on the number of minerals by which one or the other food is richer. The "coverage" charts below show how much of the daily needs can be covered by 300 grams of the food.
7
100 g
300 g
1 tbsp - 16g 1 oz - 28.35g
Magnesium
Magnesium
Calcium
Calcium
Potassium
Potassium
Iron
Iron
Copper
Copper
Zinc
Zinc
Phosphorus
Phosphorus
Sodium
Sodium
Manganese
Manganese
Selenium
Selenium
214%
83%
16%
446%
37%
26%
153%
196%
6.5%
357%
3
100 g
300 g
3 oz - 85g 1 chop, excluding refuse (yield from 1 raw chop, with refuse, weighing 151 g) - 87g
Magnesium
Magnesium
Calcium
Calcium
Potassium
Potassium
Iron
Iron
Copper
Copper
Zinc
Zinc
Phosphorus
Phosphorus
Sodium
Sodium
Manganese
Manganese
Selenium
Selenium
20%
5.7%
37%
33%
24%
65%
105%
8.1%
1.2%
247%
Vitamin Comparison
Vitamin comparison score is based on the number of vitamins by which one or the other food is richer. The "coverage" charts below show how much of the daily needs can be covered by 300 grams of the food.
8
100 g
300 g
1 tbsp - 16g 1 oz - 28.35g
Vitamin C
Vit. C
Vitamin D
Vit. D
Vitamin A
Vit. A
Vitamin E
Vit. E
Vitamin B1
Vit. B1
Vitamin B2
Vit. B2
Vitamin B3
Vit. B3
Vitamin B5
Vit. B5
Vitamin B6
Vit. B6
Vitamin B12
Vit. B12
Vitamin K
Vit. K
Folate
Folate
0%
44%
90%
38%
48%
143%
2.3%
210%
74%
2500%
1.5%
38%
4
100 g
300 g
3 oz - 85g 1 chop, excluding refuse (yield from 1 raw chop, with refuse, weighing 151 g) - 87g
Vitamin C
Vit. C
Vitamin D
Vit. D
Vitamin A
Vit. A
Vitamin E
Vit. E
Vitamin B1
Vit. B1
Vitamin B2
Vit. B2
Vitamin B3
Vit. B3
Vitamin B5
Vit. B5
Vitamin B6
Vit. B6
Vitamin B12
Vit. B12
Vitamin K
Vit. K
Folate
Folate
2%
20%
0.67%
5.8%
219%
74%
94%
42%
107%
88%
0%
3.8%
All nutrients comparison - raw data values
Nutrient
DV% diff.
Vitamin B12
20µg
0.7µg
804%
Cholesterol
588mg
80mg
169%
Iron
11.88mg
0.87mg
138%
Choline
490.9mg
93.9mg
72%
Magnesium
300mg
28mg
65%
Sodium
1500mg
62mg
63%
Vitamin B1
0.19mg
0.877mg
57%
Vitamin B5
3.5mg
0.698mg
56%
Polyunsaturated fat
7.405g
1.2g
41%
Selenium
65.5µg
45.3µg
37%
Vitamin B3
0.12mg
5.037mg
31%
Vitamin A
271µg
2µg
30%
Calcium
275mg
19mg
26%
Vitamin B2
0.62mg
0.321mg
23%
Phosphorus
356mg
246mg
16%
Zinc
0.95mg
2.39mg
13%
Vitamin E
1.89mg
0.29mg
11%
Vitamin B6
0.32mg
0.464mg
11%
Folate
50µg
5µg
11%
Vitamin D*
117 IU
53 IU
8%
Vitamin D
2.9µg
1.3µg
8%
Potassium
181mg
423mg
7%
Fats
17.9g
13.92g
6%
Protein
24.6g
27.32g
5%
Saturated fat
4.06g
5.23g
5%
Copper
0.11mg
0.073mg
4%
Monounsaturated fat
4.631g
6.19g
4%
Manganese
0.05mg
0.009mg
2%
Calories
264kcal
242kcal
1%
Vitamin C
0mg
0.6mg
1%
Carbs
4g
0g
1%
Vitamin K
0.6µg
0µg
1%
Protein per 100 calories
9.3g
11g
N/A
Calories per 10 g protein
107kcal
89kcal
N/A
Weight per 100 calories
38g
41g
N/A
Unsaturated / Saturated Fat ratio
3
1.4
N/A
Net carbs
4g
0g
N/A
Tryptophan
0.323mg
0.338mg
0%
Threonine
1.263mg
1.234mg
0%
Isoleucine
1.035mg
1.26mg
0%
Leucine
2.133mg
2.177mg
0%
Lysine
1.834mg
2.446mg
0%
Methionine
0.646mg
0.712mg
0%
Phenylalanine
1.071mg
1.086mg
0%
Valine
1.263mg
1.473mg
0%
Histidine
0.649mg
1.067mg
0%
Omega-3 - EPA
2.741g
0g
N/A
Omega-3 - DHA
3.8g
0g
N/A
Omega-3 - DPA
0.229g
0g
N/A
Macronutrient Comparison
Macronutrient breakdown side-by-side comparison
3
25%
18%
4%
48%
6%
Protein:
24.6 g
Fats:
17.9 g
Carbs:
4 g
Water:
47.5 g
Other:
6 g
2
27%
14%
58%
Protein:
27.32 g
Fats:
13.92 g
Carbs:
0 g
Water:
57.87 g
Other:
0.89 g
Contains
more
Fats Fats
+28.6%
Contains
more
Carbs Carbs
+∞%
Contains
more
Other Other
+574.2%
Contains
more
Protein Protein
+11.1%
Contains
more
Water Water
+21.8%
Fat Type Comparison
Fat type breakdown side-by-side comparison
2
25%
29%
46%
Saturated fat:
Sat. Fat
4.06 g
Monounsaturated fat:
Mono. Fat
4.631 g
Polyunsaturated fat:
Poly. Fat
7.405 g
1
41%
49%
10%
Saturated fat:
Sat. Fat
5.23 g
Monounsaturated fat:
Mono. Fat
6.19 g
Polyunsaturated fat:
Poly. Fat
1.2 g
Contains
less
Sat. Fat Saturated fat
-22.4%
Contains
more
Poly. Fat Polyunsaturated fat
+517.1%
Contains
more
Mono. Fat Monounsaturated fat
+33.7%