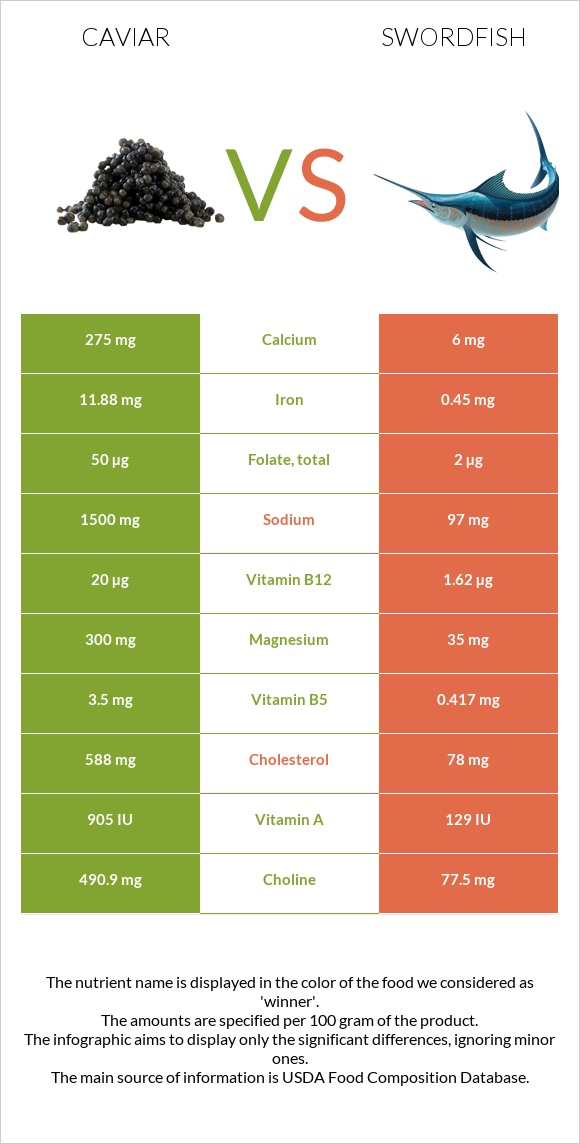
Summary of differences between caviar and swordfish Caviar has more vitamin B12, iron, choline, magnesium, vitamin B5, and vitamin B2, while swordfish has more vitamin D* and vitamin B3. Caviar covers your daily need for vitamin B12, 766% more than swordfish. Caviar contains 26 times more iron than swordfish. While caviar contains 11.88mg of iron, swordfish contains only 0.45mg. The amount of sodium in swordfish is lower. These are the specific foods used in this comparison Fish, caviar, black, and red, granular and Fish, swordfish, cooked, dry heat .
Infographic
Mineral Comparison
Mineral comparison score is based on the number of minerals by which one or the other food is richer. The "coverage" charts below show how much of the daily needs can be covered by 300 grams of the food.
7
100 g
300 g
1 tbsp - 16g 1 oz - 28.35g
Magnesium
Magnesium
Calcium
Calcium
Potassium
Potassium
Iron
Iron
Copper
Copper
Zinc
Zinc
Phosphorus
Phosphorus
Sodium
Sodium
Manganese
Manganese
Selenium
Selenium
214%
83%
16%
446%
37%
26%
153%
196%
6.5%
357%
2
100 g
300 g
3 oz - 85g 1 piece - 106g
Magnesium
Magnesium
Calcium
Calcium
Potassium
Potassium
Iron
Iron
Copper
Copper
Zinc
Zinc
Phosphorus
Phosphorus
Sodium
Sodium
Manganese
Manganese
Selenium
Selenium
25%
1.8%
44%
17%
15%
21%
130%
13%
1.7%
374%
Vitamin Comparison
Vitamin comparison score is based on the number of vitamins by which one or the other food is richer. The "coverage" charts below show how much of the daily needs can be covered by 300 grams of the food.
7
100 g
300 g
1 tbsp - 16g 1 oz - 28.35g
Vitamin C
Vit. C
Vitamin D
Vit. D
Vitamin A
Vit. A
Vitamin E
Vit. E
Vitamin B1
Vit. B1
Vitamin B2
Vit. B2
Vitamin B3
Vit. B3
Vitamin B5
Vit. B5
Vitamin B6
Vit. B6
Vitamin B12
Vit. B12
Vitamin K
Vit. K
Folate
Folate
0%
44%
90%
38%
48%
143%
2.3%
210%
74%
2500%
1.5%
38%
4
100 g
300 g
3 oz - 85g 1 piece - 106g
Vitamin C
Vit. C
Vitamin D
Vit. D
Vitamin A
Vit. A
Vitamin E
Vit. E
Vitamin B1
Vit. B1
Vitamin B2
Vit. B2
Vitamin B3
Vit. B3
Vitamin B5
Vit. B5
Vitamin B6
Vit. B6
Vitamin B12
Vit. B12
Vitamin K
Vit. K
Folate
Folate
0%
249%
14%
48%
22%
15%
174%
25%
142%
203%
0.25%
1.5%
All nutrients comparison - raw data values
Nutrient
DV% diff.
Vitamin B12
20µg
1.62µg
766%
Cholesterol
588mg
78mg
170%
Iron
11.88mg
0.45mg
143%
Choline
490.9mg
77.5mg
75%
Vitamin D*
117 IU
666 IU
69%
Vitamin D
2.9µg
16.6µg
69%
Magnesium
300mg
35mg
63%
Vitamin B5
3.5mg
0.417mg
62%
Sodium
1500mg
97mg
61%
Vitamin B3
0.12mg
9.254mg
57%
Vitamin B2
0.62mg
0.063mg
43%
Polyunsaturated fat
7.405g
1.368g
40%
Calcium
275mg
6mg
27%
Vitamin A
271µg
43µg
25%
Vitamin B6
0.32mg
0.615mg
23%
Fats
17.9g
7.93g
15%
Folate
50µg
2µg
12%
Saturated fat
4.06g
1.911g
10%
Potassium
181mg
499mg
9%
Vitamin B1
0.19mg
0.089mg
8%
Copper
0.11mg
0.046mg
7%
Phosphorus
356mg
304mg
7%
Calories
264kcal
172kcal
5%
Selenium
65.5µg
68.5µg
5%
Vitamin E
1.89mg
2.41mg
3%
Monounsaturated fat
4.631g
3.544g
3%
Protein
24.6g
23.45g
2%
Zinc
0.95mg
0.78mg
2%
Manganese
0.05mg
0.013mg
2%
Carbs
4g
0g
1%
Protein per 100 calories
9.3g
14g
N/A
Calories per 10 g protein
107kcal
73kcal
N/A
Weight per 100 calories
38g
58g
N/A
Unsaturated / Saturated Fat ratio
3
2.6
N/A
Net carbs
4g
0g
N/A
Vitamin K
0.6µg
0.1µg
0%
Trans fat
0.056g
N/A
Tryptophan
0.323mg
0.265mg
0%
Threonine
1.263mg
1.035mg
0%
Isoleucine
1.035mg
1.088mg
0%
Leucine
2.133mg
1.919mg
0%
Lysine
1.834mg
2.168mg
0%
Methionine
0.646mg
0.699mg
0%
Phenylalanine
1.071mg
0.922mg
0%
Valine
1.263mg
1.216mg
0%
Histidine
0.649mg
0.695mg
0%
Omega-3 - EPA
2.741g
0.127g
N/A
Omega-3 - DHA
3.8g
0.772g
N/A
Omega-3 - DPA
0.229g
0.168g
N/A
Omega-6 - Eicosadienoic acid
0.022g
N/A
Macronutrient Comparison
Macronutrient breakdown side-by-side comparison
4
25%
18%
4%
48%
6%
Protein:
24.6 g
Fats:
17.9 g
Carbs:
4 g
Water:
47.5 g
Other:
6 g
1
23%
8%
68%
Protein:
23.45 g
Fats:
7.93 g
Carbs:
0 g
Water:
68.26 g
Other:
0.36 g
Contains
more
Fats Fats
+125.7%
Contains
more
Carbs Carbs
+∞%
Contains
more
Other Other
+1566.7%
Contains
more
Water Water
+43.7%
~equal in
Protein
~23.45g
Fat Type Comparison
Fat type breakdown side-by-side comparison
2
25%
29%
46%
Saturated fat:
Sat. Fat
4.06 g
Monounsaturated fat:
Mono. Fat
4.631 g
Polyunsaturated fat:
Poly. Fat
7.405 g
1
28%
52%
20%
Saturated fat:
Sat. Fat
1.911 g
Monounsaturated fat:
Mono. Fat
3.544 g
Polyunsaturated fat:
Poly. Fat
1.368 g
Contains
more
Mono. Fat Monounsaturated fat
+30.7%
Contains
more
Poly. Fat Polyunsaturated fat
+441.3%
Contains
less
Sat. Fat Saturated fat
-52.9%