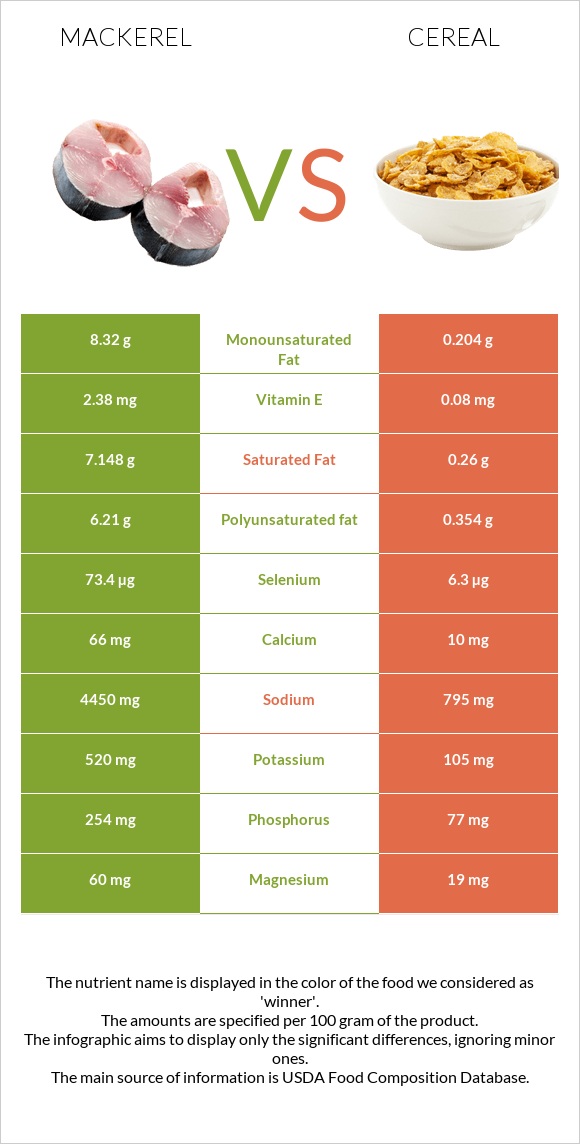
A recap on the differences between mackerel and cereal Mackerel is higher in selenium, yet cereal is higher in vitamin B1, vitamin B6, iron, vitamin B2, vitamin B3, zinc, vitamin A, vitamin C, and manganese. Cereal covers your daily vitamin B1 needs 511% more than mackerel. Mackerel contains 8 times more selenium than cereal. While mackerel contains 51.6µg of selenium, cereal contains only 6.3µg. The glycemic index of mackerel is lower. Food varieties used in this article are Fish, mackerel, Atlantic, cooked, dry heat and Cereals ready-to-eat, USDA Commodity Corn and Rice (includes all commodity brands) .
Infographic
Mineral Comparison
Mineral comparison score is based on the number of minerals by which one or the other food is richer. The "coverage" charts below show how much of the daily needs can be covered by 300 grams of the food.
6
100 g
300 g
3 oz - 85g 1 fillet - 88g
Magnesium
Magnesium
Calcium
Calcium
Potassium
Potassium
Iron
Iron
Copper
Copper
Zinc
Zinc
Phosphorus
Phosphorus
Sodium
Sodium
Manganese
Manganese
Selenium
Selenium
69%
4.5%
35%
59%
31%
26%
119%
11%
2.6%
281%
4
100 g
300 g
1 cup - 29g 1 serving (NLEA serving = 1 cup) - 29g
Magnesium
Magnesium
Calcium
Calcium
Potassium
Potassium
Iron
Iron
Copper
Copper
Zinc
Zinc
Phosphorus
Phosphorus
Sodium
Sodium
Manganese
Manganese
Selenium
Selenium
14%
3%
9.3%
1277%
46%
207%
33%
104%
103%
34%
Vitamin Comparison
Vitamin comparison score is based on the number of vitamins by which one or the other food is richer. The "coverage" charts below show how much of the daily needs can be covered by 300 grams of the food.
3
100 g
300 g
3 oz - 85g 1 fillet - 88g
Vitamin C
Vit. C
Vitamin D
Vit. D
Vitamin A
Vit. A
Vitamin E
Vit. E
Vitamin B1
Vit. B1
Vitamin B2
Vit. B2
Vitamin B3
Vit. B3
Vitamin B5
Vit. B5
Vitamin B6
Vit. B6
Vitamin B12
Vit. B12
Vitamin K
Vit. K
Folate
Folate
1.3%
0%
18%
0%
40%
95%
128%
59%
106%
2375%
0%
1.5%
7
100 g
300 g
1 cup - 29g 1 serving (NLEA serving = 1 cup) - 29g
Vitamin C
Vit. C
Vitamin D
Vit. D
Vitamin A
Vit. A
Vitamin E
Vit. E
Vitamin B1
Vit. B1
Vitamin B2
Vit. B2
Vitamin B3
Vit. B3
Vitamin B5
Vit. B5
Vitamin B6
Vit. B6
Vitamin B12
Vit. B12
Vitamin K
Vit. K
Folate
Folate
128%
0%
271%
1.6%
1572%
893%
555%
14%
1381%
0%
0%
0%
All nutrients comparison - raw data values
Nutrient
DV% diff.
Vitamin B12
19µg
792%
Vitamin B1
0.159mg
6.288mg
511%
Vitamin B6
0.46mg
5.986mg
425%
Iron
1.57mg
34.06mg
406%
Vitamin B2
0.412mg
3.87mg
266%
Vitamin B3
6.85mg
29.62mg
142%
Vitamin A
54µg
814µg
84%
Selenium
51.6µg
6.3µg
82%
Zinc
0.94mg
7.6mg
61%
Vitamin C
0.4mg
38.5mg
42%
Protein
23.85g
6.06g
36%
Manganese
0.02mg
0.79mg
33%
Sodium
83mg
795mg
31%
Carbs
0g
86.85g
29%
Phosphorus
278mg
77mg
29%
Fats
17.81g
1.08g
26%
Polyunsaturated fat
4.3g
0.354g
26%
Cholesterol
75mg
25%
Magnesium
97mg
19mg
19%
Saturated fat
4.176g
0.26g
18%
Monounsaturated fat
7.006g
0.204g
17%
Vitamin B5
0.99mg
0.226mg
15%
Potassium
401mg
105mg
9%
Calories
262kcal
378kcal
6%
Fiber
0g
1.4g
6%
Copper
0.094mg
0.137mg
5%
Calcium
15mg
10mg
1%
Vitamin E
0.08mg
1%
Folate
2µg
1%
Protein per 100 calories
9.1g
1.6g
N/A
Calories per 10 g protein
110kcal
624kcal
N/A
Weight per 100 calories
38g
26g
N/A
Unsaturated / Saturated Fat ratio
2.7
2.1
N/A
Net carbs
0g
85.45g
N/A
Sugar
10.35g
N/A
Tryptophan
0.267mg
0.066mg
0%
Threonine
1.045mg
0.241mg
0%
Isoleucine
1.099mg
0.26mg
0%
Leucine
1.938mg
0.767mg
0%
Lysine
2.19mg
0.113mg
0%
Methionine
0.706mg
0.13mg
0%
Phenylalanine
0.931mg
0.365mg
0%
Valine
1.228mg
0.344mg
0%
Histidine
0.702mg
0.162mg
0%
Fructose
0.26g
0%
Omega-3 - EPA
0.504g
0g
N/A
Omega-3 - DHA
0.699g
0g
N/A
Omega-3 - DPA
0.106g
0g
N/A
Macronutrient Comparison
Macronutrient breakdown side-by-side comparison
4
24%
18%
53%
5%
Protein:
23.85 g
Fats:
17.81 g
Carbs:
0 g
Water:
53.27 g
Other:
5.07 g
1
6%
87%
4%
2%
Protein:
6.06 g
Fats:
1.08 g
Carbs:
86.85 g
Water:
3.78 g
Other:
2.23 g
Contains
more
Protein Protein
+293.6%
Contains
more
Fats Fats
+1549.1%
Contains
more
Water Water
+1309.3%
Contains
more
Other Other
+127.4%
Contains
more
Carbs Carbs
+∞%
Fat Type Comparison
Fat type breakdown side-by-side comparison
2
27%
45%
28%
Saturated fat:
Sat. Fat
4.176 g
Monounsaturated fat:
Mono. Fat
7.006 g
Polyunsaturated fat:
Poly. Fat
4.3 g
1
32%
25%
43%
Saturated fat:
Sat. Fat
0.26 g
Monounsaturated fat:
Mono. Fat
0.204 g
Polyunsaturated fat:
Poly. Fat
0.354 g
Contains
more
Mono. Fat Monounsaturated fat
+3334.3%
Contains
more
Poly. Fat Polyunsaturated fat
+1114.7%
Contains
less
Sat. Fat Saturated fat
-93.8%