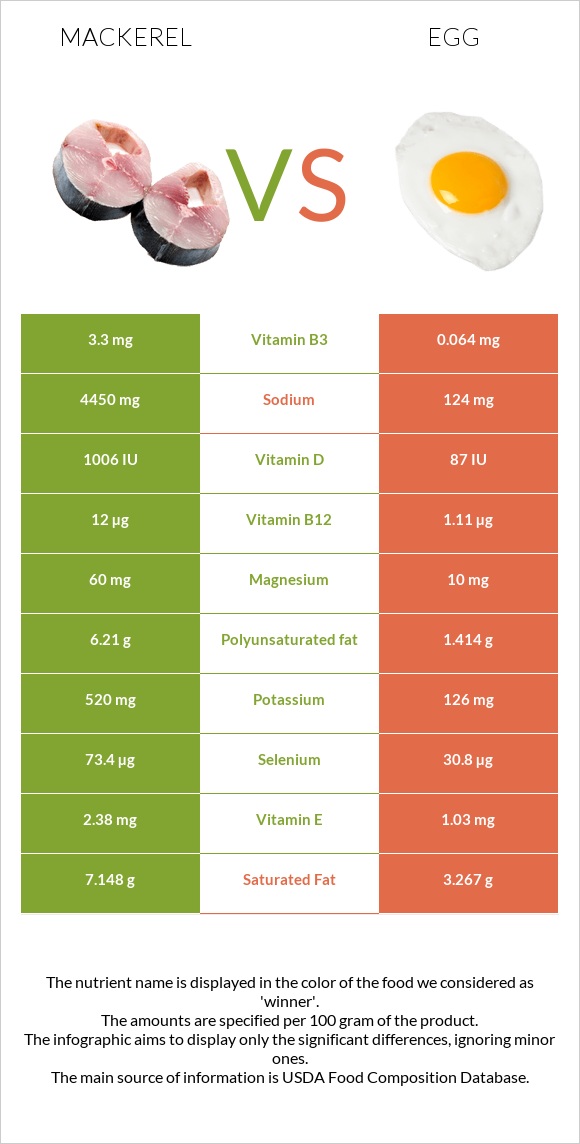
What are the main differences between mackerel and eggs? Mackerel is richer in vitamin B12, vitamin B3, selenium, vitamin B6, magnesium, and phosphorus, while eggs are higher in copper, folate, and vitamin B5. Mackerel's daily need coverage for vitamin B12 is 745% higher. Eggs have 107 times less vitamin B3 than mackerel. Mackerel has 6.85mg of vitamin B3, while eggs have 0.064mg. Mackerel is lower in cholesterol. We used Fish, mackerel, Atlantic, cooked, dry heat and Egg, whole, cooked, hard-boiled types in this comparison.
Infographic
Mineral Comparison
Mineral comparison score is based on the number of minerals by which one or the other food is richer. The "coverage" charts below show how much of the daily needs can be covered by 300 grams of the food.
6
100 g
300 g
3 oz - 85g 1 fillet - 88g
Magnesium
Magnesium
Calcium
Calcium
Potassium
Potassium
Iron
Iron
Copper
Copper
Zinc
Zinc
Phosphorus
Phosphorus
Sodium
Sodium
Manganese
Manganese
Selenium
Selenium
69%
4.5%
35%
59%
31%
26%
119%
11%
2.6%
281%
4
100 g
300 g
1 tbsp - 8.5g 1 large - 50g 1 cup, chopped - 136g
Magnesium
Magnesium
Calcium
Calcium
Potassium
Potassium
Iron
Iron
Copper
Copper
Zinc
Zinc
Phosphorus
Phosphorus
Sodium
Sodium
Manganese
Manganese
Selenium
Selenium
7.1%
15%
11%
45%
667%
29%
74%
16%
3.4%
168%
Vitamin Comparison
Vitamin comparison score is based on the number of vitamins by which one or the other food is richer. The "coverage" charts below show how much of the daily needs can be covered by 300 grams of the food.
5
100 g
300 g
3 oz - 85g 1 fillet - 88g
Vitamin C
Vit. C
Vitamin D
Vit. D
Vitamin A
Vit. A
Vitamin E
Vit. E
Vitamin B1
Vit. B1
Vitamin B2
Vit. B2
Vitamin B3
Vit. B3
Vitamin B5
Vit. B5
Vitamin B6
Vit. B6
Vitamin B12
Vit. B12
Vitamin K
Vit. K
Folate
Folate
1.3%
0%
18%
0%
40%
95%
128%
59%
106%
2375%
0%
1.5%
7
100 g
300 g
1 tbsp - 8.5g 1 large - 50g 1 cup, chopped - 136g
Vitamin C
Vit. C
Vitamin D
Vit. D
Vitamin A
Vit. A
Vitamin E
Vit. E
Vitamin B1
Vit. B1
Vitamin B2
Vit. B2
Vitamin B3
Vit. B3
Vitamin B5
Vit. B5
Vitamin B6
Vit. B6
Vitamin B12
Vit. B12
Vitamin K
Vit. K
Folate
Folate
0%
33%
50%
21%
17%
118%
1.2%
84%
28%
139%
0.75%
33%
All nutrients comparison - raw data values
Nutrient
DV% diff.
Vitamin B12
19µg
1.11µg
745%
Copper
0.094mg
2mg
212%
Cholesterol
75mg
373mg
99%
Choline
293.8mg
53%
Vitamin B3
6.85mg
0.064mg
42%
Selenium
51.6µg
30.8µg
38%
Vitamin B6
0.46mg
0.121mg
26%
Protein
23.85g
12.58g
23%
Magnesium
97mg
10mg
21%
Polyunsaturated fat
4.3g
1.414g
19%
Phosphorus
278mg
172mg
15%
Fats
17.81g
10.61g
11%
Vitamin D*
87 IU
11%
Vitamin D
2.2µg
11%
Vitamin A
54µg
149µg
11%
Folate
2µg
44µg
11%
Potassium
401mg
126mg
8%
Vitamin B1
0.159mg
0.066mg
8%
Vitamin B2
0.412mg
0.513mg
8%
Vitamin B5
0.99mg
1.398mg
8%
Vitamin E
1.03mg
7%
Monounsaturated fat
7.006g
4.077g
7%
Calories
262kcal
155kcal
5%
Iron
1.57mg
1.19mg
5%
Calcium
15mg
50mg
4%
Saturated fat
4.176g
3.267g
4%
Sodium
83mg
124mg
2%
Zinc
0.94mg
1.05mg
1%
Protein per 100 calories
9.1g
8.1g
N/A
Calories per 10 g protein
110kcal
123kcal
N/A
Weight per 100 calories
38g
65g
N/A
Unsaturated / Saturated Fat ratio
2.7
1.7
N/A
Vitamin C
0.4mg
0mg
0%
Net carbs
0g
1.12g
N/A
Carbs
0g
1.12g
0%
Sugar
1.12g
N/A
Manganese
0.02mg
0.026mg
0%
Vitamin K
0.3µg
0%
Tryptophan
0.267mg
0.153mg
0%
Threonine
1.045mg
0.604mg
0%
Isoleucine
1.099mg
0.686mg
0%
Leucine
1.938mg
1.075mg
0%
Lysine
2.19mg
0.904mg
0%
Methionine
0.706mg
0.392mg
0%
Phenylalanine
0.931mg
0.668mg
0%
Valine
1.228mg
0.767mg
0%
Histidine
0.702mg
0.298mg
0%
Omega-3 - EPA
0.504g
0.005g
N/A
Omega-3 - DHA
0.699g
0.038g
N/A
Omega-3 - DPA
0.106g
0g
N/A
Macronutrient Comparison
Macronutrient breakdown side-by-side comparison
3
24%
18%
53%
5%
Protein:
23.85 g
Fats:
17.81 g
Carbs:
0 g
Water:
53.27 g
Other:
5.07 g
2
13%
11%
75%
Protein:
12.58 g
Fats:
10.61 g
Carbs:
1.12 g
Water:
74.62 g
Other:
1.07 g
Contains
more
Protein Protein
+89.6%
Contains
more
Fats Fats
+67.9%
Contains
more
Other Other
+373.8%
Contains
more
Carbs Carbs
+∞%
Contains
more
Water Water
+40.1%
Fat Type Comparison
Fat type breakdown side-by-side comparison
2
27%
45%
28%
Saturated fat:
Sat. Fat
4.176 g
Monounsaturated fat:
Mono. Fat
7.006 g
Polyunsaturated fat:
Poly. Fat
4.3 g
1
37%
47%
16%
Saturated fat:
Sat. Fat
3.267 g
Monounsaturated fat:
Mono. Fat
4.077 g
Polyunsaturated fat:
Poly. Fat
1.414 g
Contains
more
Mono. Fat Monounsaturated fat
+71.8%
Contains
more
Poly. Fat Polyunsaturated fat
+204.1%
Contains
less
Sat. Fat Saturated fat
-21.8%