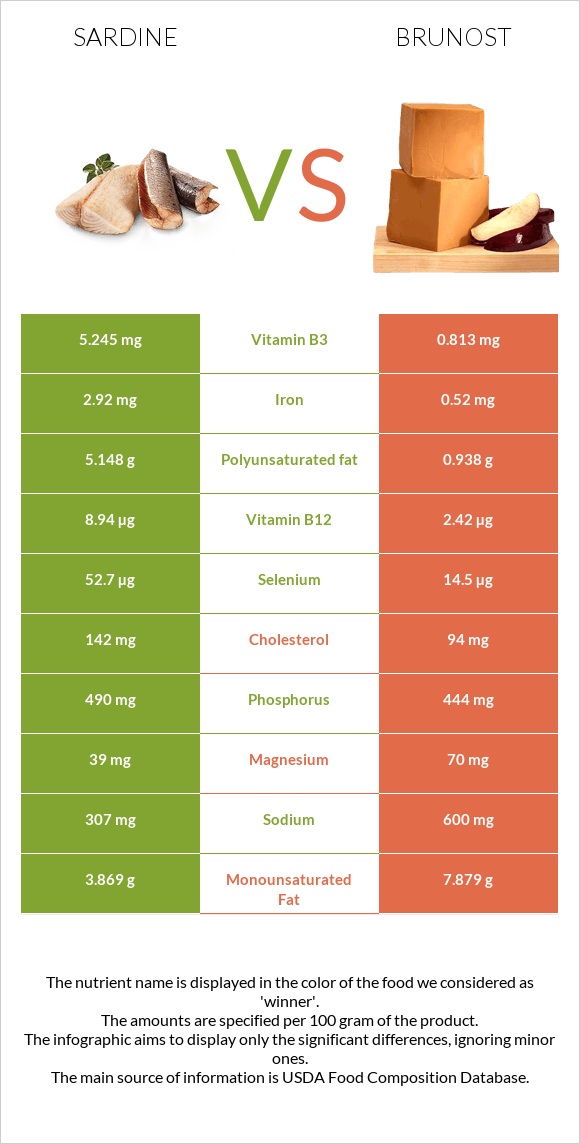
How are sardines and brunost different? Sardines are higher in vitamin B12, selenium, iron, and vitamin B3; however, brunost is richer in vitamin B2, vitamin B5, potassium, vitamin A, and vitamin B1. Daily need coverage for vitamin B12 for sardines is 272% higher. Sardines contain 6 times more vitamin B3 than brunost. While sardines contain 5.245mg of vitamin B3, brunost contains only 0.813mg. Sardines have less saturated fat. Sardines have a lower glycemic index (0) than brunost (27). Fish, sardine, Atlantic, canned in oil, drained solids with bone and Cheese, gjetost are the varieties used in this article.
Infographic
Mineral Comparison
Mineral comparison score is based on the number of minerals by which one or the other food is richer. The "coverage" charts below show how much of the daily needs can be covered by 300 grams of the food.
6
100 g
300 g
1 small (2-2/3" x 1/2" x 1/4") - 12g 1 cubic inch - 16g 2 sardines - 24g 1 oz - 28.35g 1 can (3.75 oz) - 92g 1 cup, drained - 149g
Magnesium
Magnesium
Calcium
Calcium
Potassium
Potassium
Iron
Iron
Copper
Copper
Zinc
Zinc
Phosphorus
Phosphorus
Sodium
Sodium
Manganese
Manganese
Selenium
Selenium
28%
115%
35%
110%
62%
36%
210%
40%
14%
287%
2
100 g
300 g
1 oz - 28.35g 1 package (8 oz) - 227g
Magnesium
Magnesium
Calcium
Calcium
Potassium
Potassium
Iron
Iron
Copper
Copper
Zinc
Zinc
Phosphorus
Phosphorus
Sodium
Sodium
Manganese
Manganese
Selenium
Selenium
50%
120%
124%
20%
27%
31%
190%
78%
5.2%
79%
Vitamin Comparison
Vitamin comparison score is based on the number of vitamins by which one or the other food is richer. The "coverage" charts below show how much of the daily needs can be covered by 300 grams of the food.
6
100 g
300 g
1 small (2-2/3" x 1/2" x 1/4") - 12g 1 cubic inch - 16g 2 sardines - 24g 1 oz - 28.35g 1 can (3.75 oz) - 92g 1 cup, drained - 149g
Vitamin C
Vit. C
Vitamin D
Vit. D
Vitamin A
Vit. A
Vitamin E
Vit. E
Vitamin B1
Vit. B1
Vitamin B2
Vit. B2
Vitamin B3
Vit. B3
Vitamin B5
Vit. B5
Vitamin B6
Vit. B6
Vitamin B12
Vit. B12
Vitamin K
Vit. K
Folate
Folate
0%
72%
11%
41%
20%
52%
98%
39%
39%
1118%
6.5%
7.5%
5
100 g
300 g
1 oz - 28.35g 1 package (8 oz) - 227g
Vitamin C
Vit. C
Vitamin D
Vit. D
Vitamin A
Vit. A
Vitamin E
Vit. E
Vitamin B1
Vit. B1
Vitamin B2
Vit. B2
Vitamin B3
Vit. B3
Vitamin B5
Vit. B5
Vitamin B6
Vit. B6
Vitamin B12
Vit. B12
Vitamin K
Vit. K
Folate
Folate
0%
0%
111%
0%
79%
319%
15%
201%
63%
303%
0%
3.8%
All nutrients comparison - raw data values
Nutrient
DV% diff.
Vitamin B12
8.94µg
2.42µg
272%
Vitamin B2
0.227mg
1.382mg
89%
Saturated fat
1.528g
19.16g
80%
Selenium
52.7µg
14.5µg
69%
Vitamin B5
0.642mg
3.351mg
54%
Vitamin A
32µg
334µg
34%
Protein
24.62g
9.65g
30%
Potassium
397mg
1409mg
30%
Iron
2.92mg
0.52mg
30%
Fats
11.45g
29.51g
28%
Vitamin B3
5.245mg
0.813mg
28%
Polyunsaturated fat
5.148g
0.938g
28%
Vitamin D*
193 IU
24%
Vitamin D
4.8µg
24%
Vitamin B1
0.08mg
0.315mg
20%
Cholesterol
142mg
94mg
16%
Carbs
0g
42.65g
14%
Vitamin E
2.04mg
14%
Choline
75mg
14%
Calories
208kcal
466kcal
13%
Sodium
307mg
600mg
13%
Copper
0.186mg
0.08mg
12%
Monounsaturated fat
3.869g
7.879g
10%
Vitamin B6
0.167mg
0.271mg
8%
Magnesium
39mg
70mg
7%
Phosphorus
490mg
444mg
7%
Manganese
0.108mg
0.04mg
3%
Calcium
382mg
400mg
2%
Zinc
1.31mg
1.14mg
2%
Vitamin K
2.6µg
2%
Folate
10µg
5µg
1%
Protein per 100 calories
12g
2.1g
N/A
Calories per 10 g protein
84kcal
483kcal
N/A
Weight per 100 calories
48g
21g
N/A
Unsaturated / Saturated Fat ratio
5.9
0.46
N/A
Net carbs
0g
42.65g
N/A
Tryptophan
0.276mg
0.135mg
0%
Threonine
1.079mg
0.393mg
0%
Isoleucine
1.134mg
0.519mg
0%
Leucine
2.001mg
0.992mg
0%
Lysine
2.26mg
0.814mg
0%
Methionine
0.729mg
0.318mg
0%
Phenylalanine
0.961mg
0.54mg
0%
Valine
1.268mg
0.765mg
0%
Histidine
0.725mg
0.293mg
0%
Omega-3 - EPA
0.473g
N/A
Omega-3 - DHA
0.509g
N/A
Macronutrient Comparison
Macronutrient breakdown side-by-side comparison
2
25%
11%
60%
4%
Protein:
24.62 g
Fats:
11.45 g
Carbs:
0 g
Water:
59.61 g
Other:
4.32 g
3
10%
30%
43%
13%
5%
Protein:
9.65 g
Fats:
29.51 g
Carbs:
42.65 g
Water:
13.44 g
Other:
4.75 g
Contains
more
Protein Protein
+155.1%
Contains
more
Water Water
+343.5%
Contains
more
Fats Fats
+157.7%
Contains
more
Carbs Carbs
+∞%
Fat Type Comparison
Fat type breakdown side-by-side comparison
2
14%
37%
49%
Saturated fat:
Sat. Fat
1.528 g
Monounsaturated fat:
Mono. Fat
3.869 g
Polyunsaturated fat:
Poly. Fat
5.148 g
1
68%
28%
3%
Saturated fat:
Sat. Fat
19.16 g
Monounsaturated fat:
Mono. Fat
7.879 g
Polyunsaturated fat:
Poly. Fat
0.938 g
Contains
less
Sat. Fat Saturated fat
-92%
Contains
more
Poly. Fat Polyunsaturated fat
+448.8%
Contains
more
Mono. Fat Monounsaturated fat
+103.6%