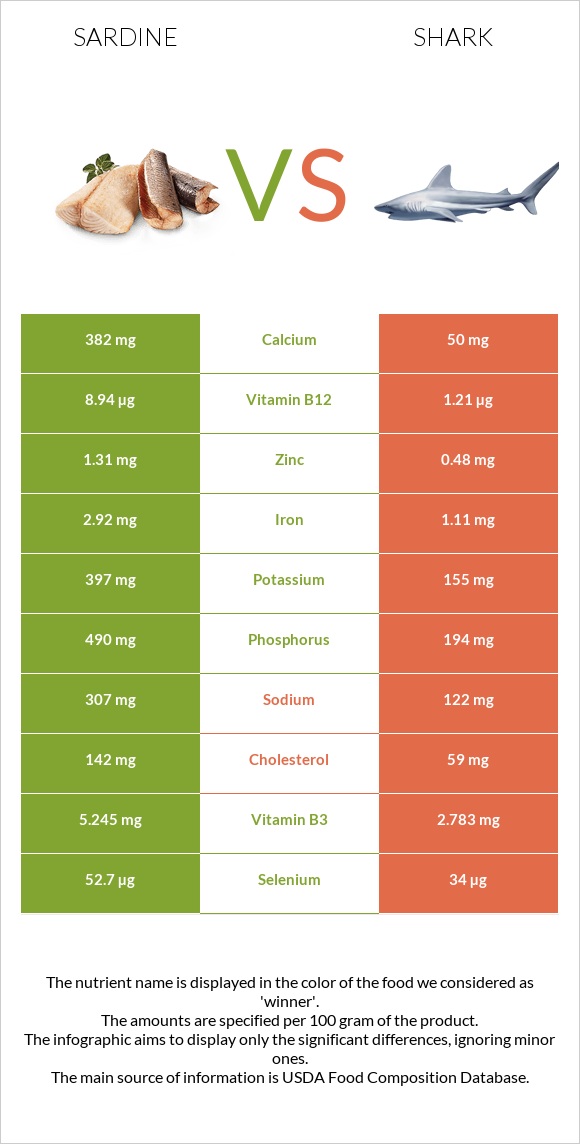
The main differences between sardines and shark Sardines are richer in vitamin B12, phosphorus, selenium, calcium, iron, copper, vitamin B3, and vitamin B2, yet shark is richer in vitamin B6. Daily need coverage for vitamin B12 for sardines is 322% higher. Sardines contain 8 times more calcium than shark. Sardines contain 382mg of calcium, while shark contains 50mg. Shark contains less cholesterol. Food types used in this article are Fish, sardine, Atlantic, canned in oil, drained solids with bone and Fish, shark, mixed species, cooked, batter-dipped and fried .
Infographic
Mineral Comparison
Mineral comparison score is based on the number of minerals by which one or the other food is richer. The "coverage" charts below show how much of the daily needs can be covered by 300 grams of the food.
8
100 g
300 g
1 small (2-2/3" x 1/2" x 1/4") - 12g 1 cubic inch - 16g 2 sardines - 24g 1 oz - 28.35g 1 can (3.75 oz) - 92g 1 cup, drained - 149g
Magnesium
Magnesium
Calcium
Calcium
Potassium
Potassium
Iron
Iron
Copper
Copper
Zinc
Zinc
Phosphorus
Phosphorus
Sodium
Sodium
Manganese
Manganese
Selenium
Selenium
28%
115%
35%
110%
62%
36%
210%
40%
14%
287%
2
100 g
300 g
3 oz - 85g
Magnesium
Magnesium
Calcium
Calcium
Potassium
Potassium
Iron
Iron
Copper
Copper
Zinc
Zinc
Phosphorus
Phosphorus
Sodium
Sodium
Manganese
Manganese
Selenium
Selenium
31%
15%
14%
42%
14%
13%
83%
16%
6.5%
185%
Vitamin Comparison
Vitamin comparison score is based on the number of vitamins by which one or the other food is richer. The "coverage" charts below show how much of the daily needs can be covered by 300 grams of the food.
6
100 g
300 g
1 small (2-2/3" x 1/2" x 1/4") - 12g 1 cubic inch - 16g 2 sardines - 24g 1 oz - 28.35g 1 can (3.75 oz) - 92g 1 cup, drained - 149g
Vitamin C
Vit. C
Vitamin D
Vit. D
Vitamin A
Vit. A
Vitamin E
Vit. E
Vitamin B1
Vit. B1
Vitamin B2
Vit. B2
Vitamin B3
Vit. B3
Vitamin B5
Vit. B5
Vitamin B6
Vit. B6
Vitamin B12
Vit. B12
Vitamin K
Vit. K
Folate
Folate
0%
72%
11%
41%
20%
52%
98%
39%
39%
1118%
6.5%
7.5%
3
100 g
300 g
3 oz - 85g
Vitamin C
Vit. C
Vitamin D
Vit. D
Vitamin A
Vit. A
Vitamin E
Vit. E
Vitamin B1
Vit. B1
Vitamin B2
Vit. B2
Vitamin B3
Vit. B3
Vitamin B5
Vit. B5
Vitamin B6
Vit. B6
Vitamin B12
Vit. B12
Vitamin K
Vit. K
Folate
Folate
0%
0%
18%
0%
18%
22%
52%
37%
69%
151%
0%
11%
All nutrients comparison - raw data values
Nutrient
DV% diff.
Vitamin B12
8.94µg
1.21µg
322%
Phosphorus
490mg
194mg
42%
Selenium
52.7µg
34µg
34%
Calcium
382mg
50mg
33%
Cholesterol
142mg
59mg
28%
Vitamin D*
193 IU
24%
Vitamin D
4.8µg
24%
Iron
2.92mg
1.11mg
23%
Copper
0.186mg
0.042mg
16%
Vitamin B3
5.245mg
2.783mg
15%
Vitamin E
2.04mg
14%
Choline
75mg
14%
Protein
24.62g
18.62g
12%
Vitamin B2
0.227mg
0.097mg
10%
Vitamin B6
0.167mg
0.3mg
10%
Polyunsaturated fat
5.148g
3.701g
10%
Zinc
1.31mg
0.48mg
8%
Sodium
307mg
122mg
8%
Saturated fat
1.528g
3.205g
8%
Potassium
397mg
155mg
7%
Monounsaturated fat
3.869g
5.935g
5%
Fats
11.45g
13.82g
4%
Manganese
0.108mg
0.05mg
3%
Carbs
0g
6.39g
2%
Vitamin A
32µg
54µg
2%
Vitamin K
2.6µg
2%
Calories
208kcal
228kcal
1%
Magnesium
39mg
43mg
1%
Vitamin B1
0.08mg
0.072mg
1%
Folate
10µg
15µg
1%
Protein per 100 calories
12g
8.2g
N/A
Calories per 10 g protein
84kcal
122kcal
N/A
Weight per 100 calories
48g
44g
N/A
Unsaturated / Saturated Fat ratio
5.9
3
N/A
Net carbs
0g
6.39g
N/A
Vitamin B5
0.642mg
0.62mg
0%
Tryptophan
0.276mg
0.212mg
0%
Threonine
1.079mg
0.843mg
0%
Isoleucine
1.134mg
0.867mg
0%
Leucine
2.001mg
1.515mg
0%
Lysine
2.26mg
1.634mg
0%
Methionine
0.729mg
0.541mg
0%
Phenylalanine
0.961mg
0.75mg
0%
Valine
1.268mg
0.965mg
0%
Histidine
0.725mg
0.538mg
0%
Omega-3 - EPA
0.473g
0.258g
N/A
Omega-3 - DHA
0.509g
0.431g
N/A
Omega-3 - DPA
0g
0.089g
N/A
Macronutrient Comparison
Macronutrient breakdown side-by-side comparison
2
25%
11%
60%
4%
Protein:
24.62 g
Fats:
11.45 g
Carbs:
0 g
Water:
59.61 g
Other:
4.32 g
3
19%
14%
6%
60%
Protein:
18.62 g
Fats:
13.82 g
Carbs:
6.39 g
Water:
60.09 g
Other:
1.08 g
Contains
more
Protein Protein
+32.2%
Contains
more
Other Other
+300%
Contains
more
Fats Fats
+20.7%
Contains
more
Carbs Carbs
+∞%
Fat Type Comparison
Fat type breakdown side-by-side comparison
2
14%
37%
49%
Saturated fat:
Sat. Fat
1.528 g
Monounsaturated fat:
Mono. Fat
3.869 g
Polyunsaturated fat:
Poly. Fat
5.148 g
1
25%
46%
29%
Saturated fat:
Sat. Fat
3.205 g
Monounsaturated fat:
Mono. Fat
5.935 g
Polyunsaturated fat:
Poly. Fat
3.701 g
Contains
less
Sat. Fat Saturated fat
-52.3%
Contains
more
Poly. Fat Polyunsaturated fat
+39.1%
Contains
more
Mono. Fat Monounsaturated fat
+53.4%