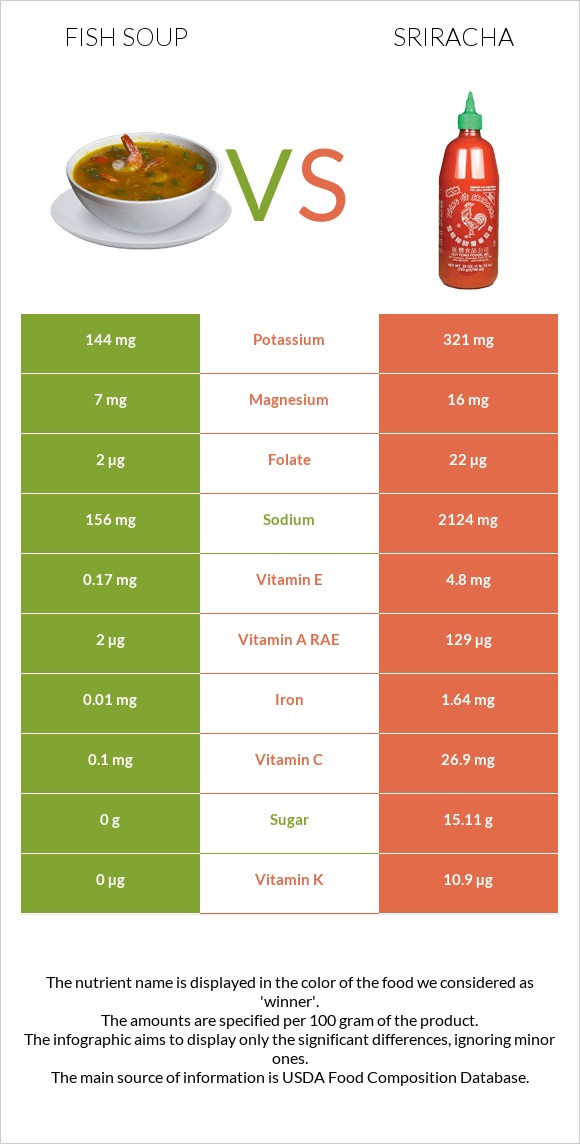
A recap on the differences between fish soup and sriracha Fish soup has less vitamin A, vitamin B6, vitamin E, vitamin C, iron, vitamin B2, vitamin K, fiber, and potassium. Sriracha covers your daily sodium needs 86% more than fish soup. Fish soup has less sodium. Food varieties used in this article are Soup, stock, fish, home-prepared and Sauce, hot chile, sriracha .
Infographic
Mineral Comparison
Mineral comparison score is based on the number of minerals by which one or the other food is richer. The "coverage" charts below show how much of the daily needs can be covered by 300 grams of the food.
3
100 g
300 g
1 cup - 233g
Magnesium
Magnesium
Calcium
Calcium
Potassium
Potassium
Iron
Iron
Copper
Copper
Zinc
Zinc
Phosphorus
Phosphorus
Sodium
Sodium
Manganese
Manganese
Selenium
Selenium
5%
0.9%
13%
0.38%
19%
1.6%
24%
20%
6.8%
5.5%
6
100 g
300 g
1 tsp - 6.5g
Magnesium
Magnesium
Calcium
Calcium
Potassium
Potassium
Iron
Iron
Copper
Copper
Zinc
Zinc
Phosphorus
Phosphorus
Sodium
Sodium
Manganese
Manganese
Selenium
Selenium
11%
5.4%
28%
62%
20%
6.5%
20%
277%
19%
2.2%
Vitamin Comparison
Vitamin comparison score is based on the number of vitamins by which one or the other food is richer. The "coverage" charts below show how much of the daily needs can be covered by 300 grams of the food.
1
100 g
300 g
1 cup - 233g
Vitamin C
Vit. C
Vitamin D
Vit. D
Vitamin A
Vit. A
Vitamin E
Vit. E
Vitamin B1
Vit. B1
Vitamin B2
Vit. B2
Vitamin B3
Vit. B3
Vitamin B5
Vit. B5
Vitamin B6
Vit. B6
Vitamin B12
Vit. B12
Vitamin K
Vit. K
Folate
Folate
0.33%
0%
0.67%
3.4%
8.3%
18%
22%
20%
8.5%
86%
0%
1.5%
9
100 g
300 g
1 tsp - 6.5g
Vitamin C
Vit. C
Vitamin D
Vit. D
Vitamin A
Vit. A
Vitamin E
Vit. E
Vitamin B1
Vit. B1
Vitamin B2
Vit. B2
Vitamin B3
Vit. B3
Vitamin B5
Vit. B5
Vitamin B6
Vit. B6
Vitamin B12
Vit. B12
Vitamin K
Vit. K
Folate
Folate
90%
0%
43%
96%
19%
51%
23%
23%
105%
0%
27%
17%
All nutrients comparison - raw data values
Nutrient
DV% diff.
Sodium
156mg
2124mg
86%
Vitamin B6
0.037mg
0.455mg
32%
Vitamin E
0.17mg
4.8mg
31%
Vitamin C
0.1mg
26.9mg
30%
Vitamin B12
0.69µg
29%
Iron
0.01mg
1.64mg
20%
Vitamin A
2µg
129µg
14%
Vitamin B2
0.076mg
0.222mg
11%
Fructose
8.16g
10%
Fiber
0g
2.2g
9%
Vitamin K
0µg
10.9µg
9%
Carbs
0g
19.16g
6%
Potassium
144mg
321mg
5%
Folate
2µg
22µg
5%
Calories
16kcal
93kcal
4%
Manganese
0.052mg
0.146mg
4%
Vitamin B1
0.033mg
0.077mg
4%
Magnesium
7mg
16mg
2%
Calcium
3mg
18mg
2%
Zinc
0.06mg
0.24mg
2%
Protein
2.26g
1.93g
1%
Phosphorus
56mg
46mg
1%
Selenium
1µg
0.4µg
1%
Vitamin B5
0.329mg
0.38mg
1%
Choline
7mg
1%
Saturated fat
0.203g
1%
Monounsaturated fat
0.236g
1%
Polyunsaturated fat
0.138g
1%
Protein per 100 calories
14g
2.1g
N/A
Calories per 10 g protein
71kcal
482kcal
N/A
Weight per 100 calories
625g
108g
N/A
Fats
0.81g
0.93g
0%
Net carbs
0g
16.96g
N/A
Cholesterol
1mg
0%
Sugar
0g
15.11g
N/A
Copper
0.058mg
0.06mg
0%
Vitamin B3
1.186mg
1.248mg
0%
Omega-3 - EPA
0.035g
N/A
Omega-3 - DHA
0.049g
N/A
Omega-3 - DPA
0.017g
N/A
Macronutrient Comparison
Macronutrient breakdown side-by-side comparison
2
2%
97%
Protein:
2.26 g
Fats:
0.81 g
Carbs:
0 g
Water:
96.6 g
Other:
0.33 g
3
2%
19%
72%
6%
Protein:
1.93 g
Fats:
0.93 g
Carbs:
19.16 g
Water:
71.84 g
Other:
6.14 g
Contains
more
Protein Protein
+17.1%
Contains
more
Water Water
+34.5%
Contains
more
Fats Fats
+14.8%
Contains
more
Carbs Carbs
+∞%
Contains
more
Other Other
+1760.6%