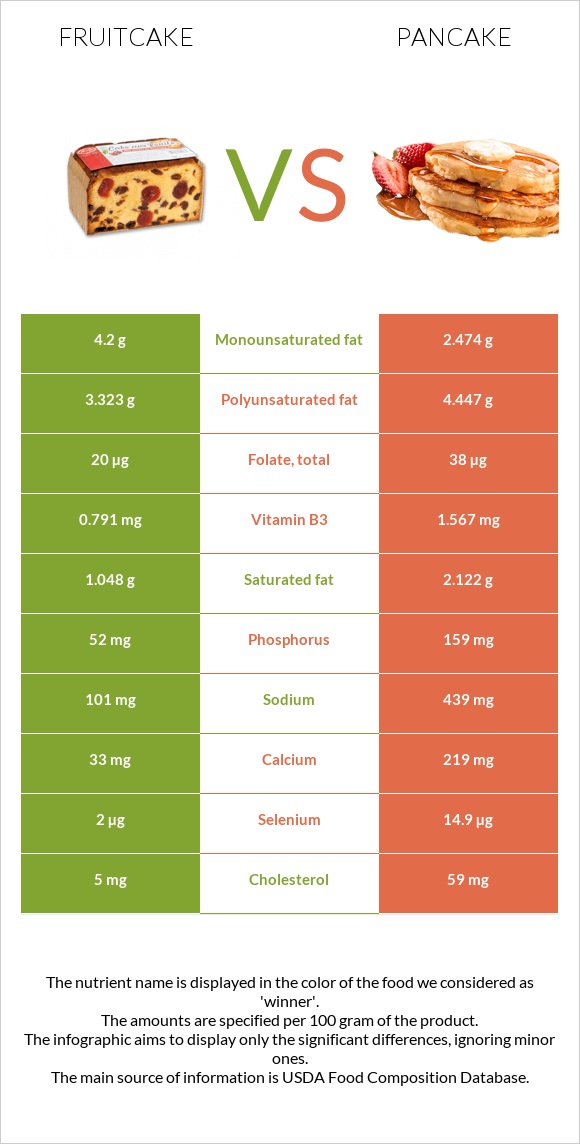
Summary of differences between fruitcake and pancake The amount of selenium, calcium, phosphorus, vitamin B2, vitamin B1, and vitamin B12 in pancake is higher than in fruitcake. Pancake covers your daily need for selenium, 23% more than fruitcake. The amount of saturated fat in fruitcake is lower. Fruitcake has a lower glycemic index. The glycemic index of fruitcake is 53, while the glycemic index of pancake is 66. These are the specific foods used in this comparison Cake, fruitcake, commercially prepared and Pancakes, plain, prepared from recipe .
Infographic
Mineral Comparison
Mineral comparison score is based on the number of minerals by which one or the other food is richer. The "coverage" charts below show how much of the daily needs can be covered by 300 grams of the food.
3
100 g
300 g
1 oz - 28.35g 1 piece - 43g
Magnesium
Magnesium
Calcium
Calcium
Potassium
Potassium
Iron
Iron
Copper
Copper
Zinc
Zinc
Phosphorus
Phosphorus
Sodium
Sodium
Manganese
Manganese
Selenium
Selenium
11%
9.9%
14%
78%
17%
7.4%
22%
13%
29%
11%
4
100 g
300 g
1 oz - 28.35g 1 pancake (4" dia) - 38g 1 pancake (6" dia) - 77g
Magnesium
Magnesium
Calcium
Calcium
Potassium
Potassium
Iron
Iron
Copper
Copper
Zinc
Zinc
Phosphorus
Phosphorus
Sodium
Sodium
Manganese
Manganese
Selenium
Selenium
11%
66%
12%
68%
16%
15%
68%
57%
26%
81%
Vitamin Comparison
Vitamin comparison score is based on the number of vitamins by which one or the other food is richer. The "coverage" charts below show how much of the daily needs can be covered by 300 grams of the food.
3
100 g
300 g
1 oz - 28.35g 1 piece - 43g
Vitamin C
Vit. C
Vitamin D
Vit. D
Vitamin A
Vit. A
Vitamin E
Vit. E
Vitamin B1
Vit. B1
Vitamin B2
Vit. B2
Vitamin B3
Vit. B3
Vitamin B5
Vit. B5
Vitamin B6
Vit. B6
Vitamin B12
Vit. B12
Vitamin K
Vit. K
Folate
Folate
1.7%
0%
2.3%
18%
13%
23%
15%
14%
11%
1.3%
3.8%
15%
7
100 g
300 g
1 oz - 28.35g 1 pancake (4" dia) - 38g 1 pancake (6" dia) - 77g
Vitamin C
Vit. C
Vitamin D
Vit. D
Vitamin A
Vit. A
Vitamin E
Vit. E
Vitamin B1
Vit. B1
Vitamin B2
Vit. B2
Vitamin B3
Vit. B3
Vitamin B5
Vit. B5
Vitamin B6
Vit. B6
Vitamin B12
Vit. B12
Vitamin K
Vit. K
Folate
Folate
1%
0%
18%
0%
50%
65%
29%
24%
11%
28%
0%
29%
All nutrients comparison - raw data values
Nutrient
DV% diff.
Selenium
2µg
14.9µg
23%
Calcium
33mg
219mg
19%
Cholesterol
5mg
59mg
18%
Fiber
3.7g
15%
Phosphorus
52mg
159mg
15%
Sodium
101mg
439mg
15%
Vitamin B2
0.099mg
0.281mg
14%
Vitamin B1
0.05mg
0.201mg
13%
Carbs
61.6g
28.3g
11%
Vitamin B12
0.01µg
0.22µg
9%
Protein
2.9g
6.4g
7%
Polyunsaturated fat
3.323g
4.447g
7%
Vitamin E
0.9mg
6%
Calories
324kcal
227kcal
5%
Vitamin A
7µg
54µg
5%
Vitamin B3
0.791mg
1.567mg
5%
Folate
20µg
38µg
5%
Saturated fat
1.048g
2.122g
5%
Vitamin B5
0.226mg
0.405mg
4%
Monounsaturated fat
4.2g
2.474g
4%
Iron
2.07mg
1.8mg
3%
Zinc
0.27mg
0.56mg
3%
Choline
8.9mg
2%
Fats
9.1g
9.7g
1%
Potassium
153mg
132mg
1%
Manganese
0.22mg
0.2mg
1%
Vitamin K
1.5µg
1%
Protein per 100 calories
0.9g
2.8g
N/A
Calories per 10 g protein
1117kcal
355kcal
N/A
Weight per 100 calories
31g
44g
N/A
Unsaturated / Saturated Fat ratio
7.2
3.3
N/A
Vitamin C
0.5mg
0.3mg
0%
Net carbs
57.9g
28.3g
N/A
Magnesium
16mg
16mg
0%
Sugar
27.42g
N/A
Copper
0.05mg
0.049mg
0%
Vitamin B6
0.046mg
0.046mg
0%
Tryptophan
0.042mg
0.08mg
0%
Threonine
0.102mg
0.237mg
0%
Isoleucine
0.121mg
0.297mg
0%
Leucine
0.206mg
0.513mg
0%
Lysine
0.121mg
0.321mg
0%
Methionine
0.059mg
0.147mg
0%
Phenylalanine
0.14mg
0.319mg
0%
Valine
0.144mg
0.335mg
0%
Histidine
0.071mg
0.152mg
0%
Omega-3 - DHA
0.001g
0.005g
N/A
Macronutrient Comparison
Macronutrient breakdown side-by-side comparison
1
3%
9%
62%
25%
Protein:
2.9 g
Fats:
9.1 g
Carbs:
61.6 g
Water:
25.3 g
Other:
1.1 g
4
6%
10%
28%
53%
3%
Protein:
6.4 g
Fats:
9.7 g
Carbs:
28.3 g
Water:
52.9 g
Other:
2.7 g
Contains
more
Carbs Carbs
+117.7%
Contains
more
Protein Protein
+120.7%
Contains
more
Water Water
+109.1%
Contains
more
Other Other
+145.5%
Fat Type Comparison
Fat type breakdown side-by-side comparison
2
12%
49%
39%
Saturated fat:
Sat. Fat
1.048 g
Monounsaturated fat:
Mono. Fat
4.2 g
Polyunsaturated fat:
Poly. Fat
3.323 g
1
23%
27%
49%
Saturated fat:
Sat. Fat
2.122 g
Monounsaturated fat:
Mono. Fat
2.474 g
Polyunsaturated fat:
Poly. Fat
4.447 g
Contains
less
Sat. Fat Saturated fat
-50.6%
Contains
more
Mono. Fat Monounsaturated fat
+69.8%
Contains
more
Poly. Fat Polyunsaturated fat
+33.8%