Infographic
Mineral Comparison
Mineral comparison score is based on the number of minerals by which one or the other food is richer. The "coverage" charts below show how much of the daily needs can be covered by 300 grams of the food.
9
100 g
300 g
3 oz - 85g 1 piece, cooked (yield from 1 lb raw meat, boneless) - 340g
Magnesium
Magnesium
Calcium
Calcium
Potassium
Potassium
Iron
Iron
Copper
Copper
Zinc
Zinc
Phosphorus
Phosphorus
Sodium
Sodium
Manganese
Manganese
Selenium
Selenium
20%
1.2%
33%
158%
71%
46%
90%
7%
2.9%
70%
1
100 g
300 g
1 serving 1.6 oz bag - 47g
Magnesium
Magnesium
Calcium
Calcium
Potassium
Potassium
Iron
Iron
Copper
Copper
Zinc
Zinc
Phosphorus
Phosphorus
Sodium
Sodium
Manganese
Manganese
Selenium
Selenium
0%
27%
0%
32%
0%
0%
0%
18%
0%
0%
Vitamin Comparison
Vitamin comparison score is based on the number of vitamins by which one or the other food is richer. The "coverage" charts below show how much of the daily needs can be covered by 300 grams of the food.
3
100 g
300 g
3 oz - 85g 1 piece, cooked (yield from 1 lb raw meat, boneless) - 340g
Vitamin C
Vit. C
Vitamin D
Vit. D
Vitamin A
Vit. A
Vitamin E
Vit. E
Vitamin B1
Vit. B1
Vitamin B2
Vit. B2
Vitamin B3
Vit. B3
Vitamin B5
Vit. B5
Vitamin B6
Vit. B6
Vitamin B12
Vit. B12
Vitamin K
Vit. K
Folate
Folate
0%
0%
0%
0%
65%
168%
0%
0%
0%
0%
0%
6.8%
1
100 g
300 g
1 serving 1.6 oz bag - 47g
Vitamin C
Vit. C
Vitamin D
Vit. D
Vitamin A
Vit. A
Vitamin E
Vit. E
Vitamin B1
Vit. B1
Vitamin B2
Vit. B2
Vitamin B3
Vit. B3
Vitamin B5
Vit. B5
Vitamin B6
Vit. B6
Vitamin B12
Vit. B12
Vitamin K
Vit. K
Folate
Folate
1.7%
0%
0%
0%
0%
0%
0%
0%
0%
0%
0%
0%
All nutrients comparison - raw data values
Nutrient
DV% diff.
Vitamin B2
0.73mg
56%
Protein
29.45g
4.28g
50%
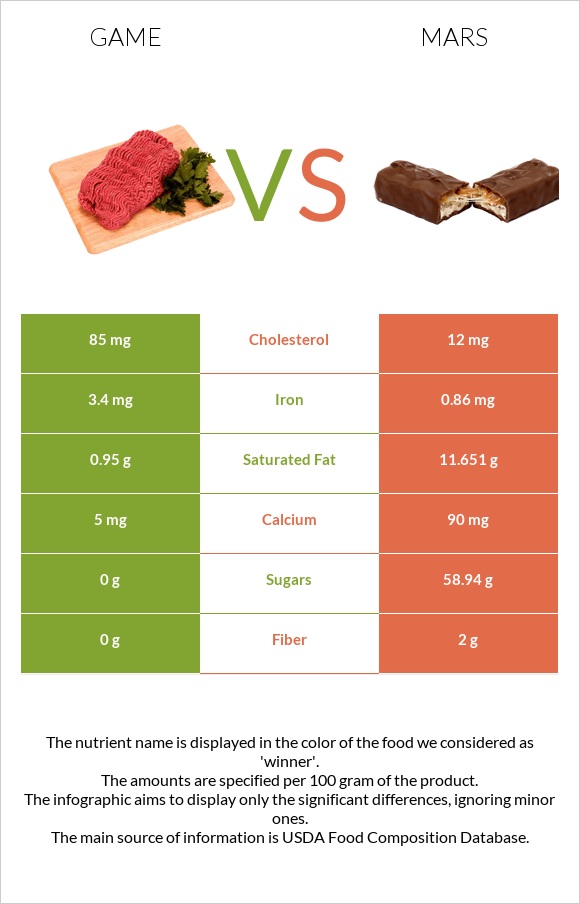
Saturated fat
0.97g
11.651g
49%
Iron
4.2mg
0.86mg
42%
Cholesterol
126mg
12mg
38%
Phosphorus
210mg
30%
Fats
2.67g
19.32g
26%
Carbs
0g
72.4g
24%
Copper
0.213mg
24%
Selenium
12.9µg
23%
Vitamin B1
0.26mg
22%
Calories
150kcal
475kcal
16%
Zinc
1.68mg
15%
Potassium
372mg
11%
Calcium
4mg
90mg
9%
Fiber
0g
2g
8%
Magnesium
28mg
7%
Sodium
54mg
136mg
4%
Polyunsaturated fat
0.58g
4%
Folate
9µg
2%
Monounsaturated fat
0.63g
2%
Vitamin C
0mg
0.5mg
1%
Manganese
0.022mg
1%
Protein per 100 calories
20g
0.9g
N/A
Calories per 10 g protein
51kcal
1110kcal
N/A
Weight per 100 calories
67g
21g
N/A
Unsaturated / Saturated Fat ratio
1.2
0
N/A
Net carbs
0g
70.4g
N/A
Sugar
58.94g
N/A
Trans fat
0.131g
N/A
Threonine
1.362mg
0%
Isoleucine
1.126mg
0%
Leucine
2.489mg
0%
Lysine
2.462mg
0%
Methionine
0.838mg
0%
Phenylalanine
1.166mg
0%
Valine
1.31mg
0%
Histidine
1.401mg
0%
Macronutrient Comparison
Macronutrient breakdown side-by-side comparison
2
29%
3%
66%
2%
Protein:
29.45 g
Fats:
2.67 g
Carbs:
0 g
Water:
65.9 g
Other:
1.98 g
3
4%
19%
72%
2%
2%
Protein:
4.28 g
Fats:
19.32 g
Carbs:
72.4 g
Water:
1.7 g
Other:
2.3 g
Contains
more
Protein Protein
+588.1%
Contains
more
Water Water
+3776.5%
Contains
more
Fats Fats
+623.6%
Contains
more
Carbs Carbs
+∞%
Contains
more
Other Other
+16.2%
Fat Type Comparison
Fat type breakdown side-by-side comparison
3
44%
29%
27%
Saturated fat:
Sat. Fat
0.97 g
Monounsaturated fat:
Mono. Fat
0.63 g
Polyunsaturated fat:
Poly. Fat
0.58 g
0
100%
Saturated fat:
Sat. Fat
11.651 g
Monounsaturated fat:
Mono. Fat
0 g
Polyunsaturated fat:
Poly. Fat
0 g
Contains
less
Sat. Fat Saturated fat
-91.7%
Contains
more
Mono. Fat Monounsaturated fat
+∞%
Contains
more
Poly. Fat Polyunsaturated fat
+∞%