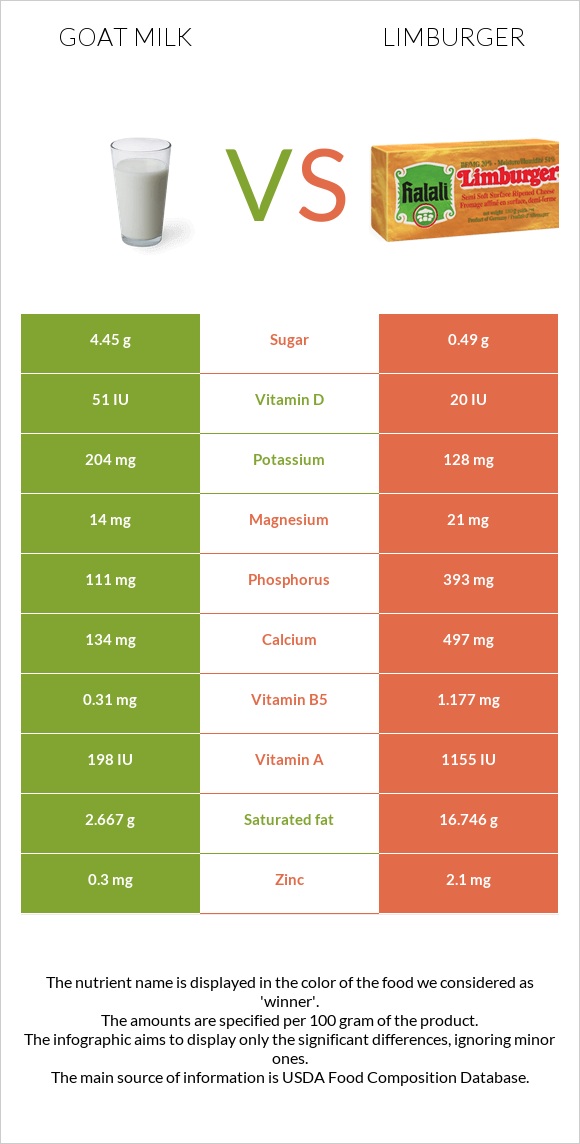
Significant differences between goat milk and Limburger The amount of vitamin B12, phosphorus, calcium, vitamin B2, selenium, vitamin A, and vitamin B5 in Limburger is higher than in goat milk. Limburger covers your daily saturated fat needs 70% more than goat milk. Goat milk contains less saturated fat. Specific food types used in this comparison are Milk, goat, fluid, with added vitamin D and Cheese, limburger .
Infographic
Mineral Comparison
Mineral comparison score is based on the number of minerals by which one or the other food is richer. The "coverage" charts below show how much of the daily needs can be covered by 300 grams of the food.
3
100 g
300 g
1 fl oz - 30.5g 1 cup - 244g 1 quart - 976g
Magnesium
Magnesium
Calcium
Calcium
Potassium
Potassium
Iron
Iron
Copper
Copper
Zinc
Zinc
Phosphorus
Phosphorus
Sodium
Sodium
Manganese
Manganese
Selenium
Selenium
10%
40%
18%
1.9%
15%
8.2%
48%
6.5%
2.3%
7.6%
7
100 g
300 g
1 cubic inch - 18g 1 oz - 28.35g 1 box - 113g 1 cup - 134g 1 package (8 oz) - 227g
Magnesium
Magnesium
Calcium
Calcium
Potassium
Potassium
Iron
Iron
Copper
Copper
Zinc
Zinc
Phosphorus
Phosphorus
Sodium
Sodium
Manganese
Manganese
Selenium
Selenium
15%
149%
11%
4.9%
7%
57%
168%
104%
5%
79%
Vitamin Comparison
Vitamin comparison score is based on the number of vitamins by which one or the other food is richer. The "coverage" charts below show how much of the daily needs can be covered by 300 grams of the food.
3
100 g
300 g
1 fl oz - 30.5g 1 cup - 244g 1 quart - 976g
Vitamin C
Vit. C
Vitamin D
Vit. D
Vitamin A
Vit. A
Vitamin E
Vit. E
Vitamin B1
Vit. B1
Vitamin B2
Vit. B2
Vitamin B3
Vit. B3
Vitamin B5
Vit. B5
Vitamin B6
Vit. B6
Vitamin B12
Vit. B12
Vitamin K
Vit. K
Folate
Folate
4.3%
20%
19%
1.4%
12%
32%
5.2%
19%
11%
8.8%
0.75%
0.75%
9
100 g
300 g
1 cubic inch - 18g 1 oz - 28.35g 1 box - 113g 1 cup - 134g 1 package (8 oz) - 227g
Vitamin C
Vit. C
Vitamin D
Vit. D
Vitamin A
Vit. A
Vitamin E
Vit. E
Vitamin B1
Vit. B1
Vitamin B2
Vit. B2
Vitamin B3
Vit. B3
Vitamin B5
Vit. B5
Vitamin B6
Vit. B6
Vitamin B12
Vit. B12
Vitamin K
Vit. K
Folate
Folate
0%
7.5%
113%
4.6%
20%
116%
3%
71%
20%
130%
5.8%
44%
All nutrients comparison - raw data values
Nutrient
DV% diff.
Saturated fat
2.667g
16.746g
64%
Phosphorus
111mg
393mg
40%
Vitamin B12
0.07µg
1.04µg
40%
Fats
4.14g
27.25g
36%
Calcium
134mg
497mg
36%
Protein
3.56g
20.05g
33%
Sodium
50mg
800mg
33%
Vitamin A
57µg
340µg
31%
Vitamin B2
0.138mg
0.503mg
28%
Cholesterol
11mg
90mg
26%
Selenium
1.4µg
14.5µg
24%
Monounsaturated fat
1.109g
8.606g
19%
Vitamin B5
0.31mg
1.177mg
17%
Zinc
0.3mg
2.1mg
16%
Folate
1µg
58µg
14%
Calories
69kcal
327kcal
13%
Vitamin D*
51 IU
20 IU
4%
Vitamin D
1.3µg
0.5µg
4%
Copper
0.046mg
0.021mg
3%
Vitamin B1
0.048mg
0.08mg
3%
Vitamin B6
0.046mg
0.086mg
3%
Magnesium
14mg
21mg
2%
Potassium
204mg
128mg
2%
Vitamin K
0.3µg
2.3µg
2%
Polyunsaturated fat
0.149g
0.495g
2%
Vitamin C
1.3mg
0mg
1%
Carbs
4.45g
0.49g
1%
Iron
0.05mg
0.13mg
1%
Vitamin E
0.07mg
0.23mg
1%
Manganese
0.018mg
0.038mg
1%
Vitamin B3
0.277mg
0.158mg
1%
Protein per 100 calories
5.2g
6.1g
N/A
Calories per 10 g protein
194kcal
163kcal
N/A
Weight per 100 calories
145g
31g
N/A
Unsaturated / Saturated Fat ratio
0.47
0.54
N/A
Net carbs
4.45g
0.49g
N/A
Sugar
4.45g
0.49g
N/A
Choline
16mg
15.4mg
0%
Tryptophan
0.044mg
0.289mg
0%
Threonine
0.163mg
0.739mg
0%
Isoleucine
0.207mg
1.219mg
0%
Leucine
0.314mg
2.093mg
0%
Lysine
0.29mg
1.675mg
0%
Methionine
0.08mg
0.619mg
0%
Phenylalanine
0.155mg
1.116mg
0%
Valine
0.24mg
1.439mg
0%
Histidine
0.089mg
0.578mg
0%
Macronutrient Comparison
Macronutrient breakdown side-by-side comparison
2
4%
4%
4%
87%
Protein:
3.56 g
Fats:
4.14 g
Carbs:
4.45 g
Water:
87.03 g
Other:
0.82 g
3
20%
27%
48%
4%
Protein:
20.05 g
Fats:
27.25 g
Carbs:
0.49 g
Water:
48.42 g
Other:
3.79 g
Contains
more
Carbs Carbs
+808.2%
Contains
more
Water Water
+79.7%
Contains
more
Protein Protein
+463.2%
Contains
more
Fats Fats
+558.2%
Contains
more
Other Other
+362.2%
Fat Type Comparison
Fat type breakdown side-by-side comparison
1
68%
28%
4%
Saturated fat:
Sat. Fat
2.667 g
Monounsaturated fat:
Mono. Fat
1.109 g
Polyunsaturated fat:
Poly. Fat
0.149 g
2
65%
33%
2%
Saturated fat:
Sat. Fat
16.746 g
Monounsaturated fat:
Mono. Fat
8.606 g
Polyunsaturated fat:
Poly. Fat
0.495 g
Contains
less
Sat. Fat Saturated fat
-84.1%
Contains
more
Mono. Fat Monounsaturated fat
+676%
Contains
more
Poly. Fat Polyunsaturated fat
+232.2%