Goat vs. Bison meat — In-Depth Nutrition Comparison
Compare
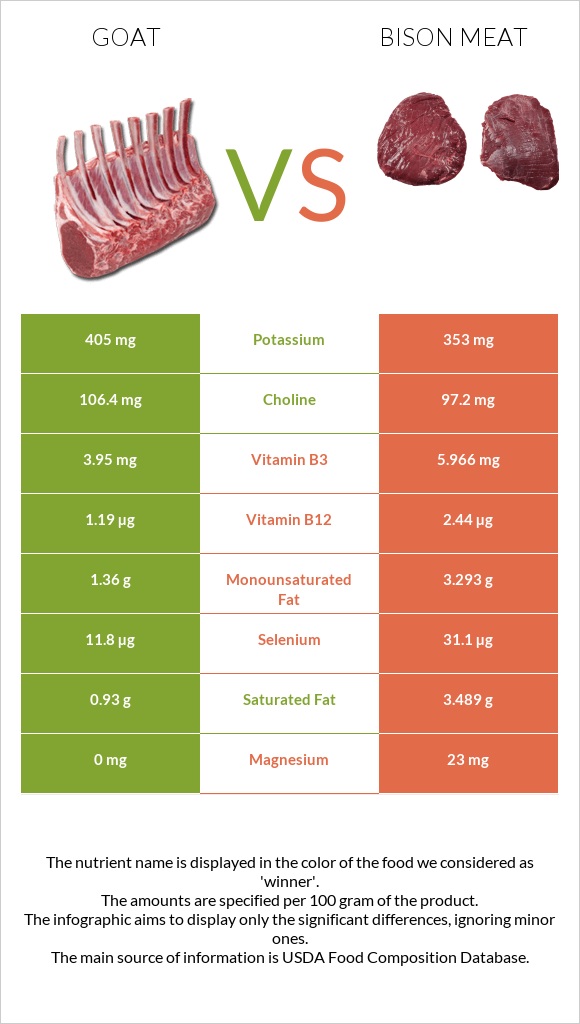
What are the main differences between goat and bison meat?
- Goat is richer in vitamin B2, copper, and zinc, while bison meat is higher in vitamin B12, selenium, vitamin B6, and magnesium.
- Bison meat's daily need coverage for vitamin B12 is 70% higher.
- Bison meat has 3 times less copper than goat. Goat has 0.303mg of copper, while bison meat has 0.107mg.
We used Game meat, goat, cooked, roasted and Game meat, bison, separable lean only, cooked, roasted types in this comparison.
Infographic
Infographic link
Mineral Comparison
Mineral comparison score is based on the number of minerals by which one or the other food is richer. The "coverage" charts below show how much of the daily needs can be covered by 300 grams of the food.
| Contains more CalciumCalcium | +112.5% |
| Contains more PotassiumPotassium | +12.2% |
| Contains more CopperCopper | +183.2% |
| Contains more ZincZinc | +43.2% |
| Contains more ManganeseManganese | +425% |
| Contains more MagnesiumMagnesium | +∞% |
| Contains less SodiumSodium | -33.7% |
| Contains more SeleniumSelenium | +200.8% |
Vitamin Comparison
Vitamin comparison score is based on the number of vitamins by which one or the other food is richer. The "coverage" charts below show how much of the daily needs can be covered by 300 grams of the food.
| Contains more Vitamin B2Vitamin B2 | +125.9% |
| Contains more Vitamin B1Vitamin B1 | +11.1% |
| Contains more Vitamin B6Vitamin B6 | +∞% |
| Contains more Vitamin B12Vitamin B12 | +140.3% |
| Contains more FolateFolate | +60% |
All nutrients comparison - raw data values
| Nutrient |  |
 |
DV% diff. |
| Vitamin B12 | 1.19µg | 2.86µg | 70% |
| Selenium | 11.8µg | 35.5µg | 43% |
| Vitamin B6 | 0mg | 0.4mg | 31% |
| Vitamin B2 | 0.61mg | 0.27mg | 26% |
| Copper | 0.303mg | 0.107mg | 22% |
| Zinc | 5.27mg | 3.68mg | 14% |
| Magnesium | 0mg | 26mg | 6% |
| Iron | 3.73mg | 3.42mg | 4% |
| Protein | 27.1g | 28.44g | 3% |
| Cholesterol | 75mg | 82mg | 2% |
| Vitamin B3 | 3.95mg | 3.71mg | 2% |
| Choline | 106.4mg | 114.8mg | 2% |
| Fats | 3.03g | 2.42g | 1% |
| Calcium | 17mg | 8mg | 1% |
| Potassium | 405mg | 361mg | 1% |
| Phosphorus | 201mg | 209mg | 1% |
| Sodium | 86mg | 57mg | 1% |
| Manganese | 0.042mg | 0.008mg | 1% |
| Vitamin B1 | 0.09mg | 0.1mg | 1% |
| Folate | 5µg | 8µg | 1% |
| Monounsaturated fat | 1.36g | 0.95g | 1% |
| Calories | 143kcal | 143kcal | 0% |
| Vitamin E | 0.34mg | 0.36mg | 0% |
| Vitamin K | 1.2µg | 1.3µg | 0% |
| Saturated fat | 0.93g | 0.91g | 0% |
| Polyunsaturated fat | 0.23g | 0.24g | 0% |
| Tryptophan | 0.403mg | 0% | |
| Threonine | 1.29mg | 1.171mg | 0% |
| Isoleucine | 1.371mg | 1.198mg | 0% |
| Leucine | 2.258mg | 2.21mg | 0% |
| Lysine | 2.016mg | 2.219mg | 0% |
| Methionine | 0.726mg | 0.674mg | 0% |
| Phenylalanine | 0.941mg | 1.065mg | 0% |
| Valine | 1.452mg | 1.287mg | 0% |
| Histidine | 0.565mg | 0.754mg | 0% |
Macronutrient Comparison
Macronutrient breakdown side-by-side comparison
Protein:
27.1 g
Fats:
3.03 g
Carbs:
0 g
Water:
68.21 g
Other:
1.66 g
Protein:
28.44 g
Fats:
2.42 g
Carbs:
0 g
Water:
66.54 g
Other:
2.6 g
| Contains more FatsFats | +25.2% |
| Contains more OtherOther | +56.6% |
~equal in
Protein
~28.44g
~equal in
Carbs
~0g
~equal in
Water
~66.54g
Fat Type Comparison
Fat type breakdown side-by-side comparison
Saturated fat:
Sat. Fat
0.93 g
Monounsaturated fat:
Mono. Fat
1.36 g
Polyunsaturated fat:
Poly. Fat
0.23 g
Saturated fat:
Sat. Fat
0.91 g
Monounsaturated fat:
Mono. Fat
0.95 g
Polyunsaturated fat:
Poly. Fat
0.24 g
| Contains more Mono. FatMonounsaturated fat | +43.2% |
~equal in
Saturated fat
~0.91g
~equal in
Polyunsaturated fat
~0.24g


