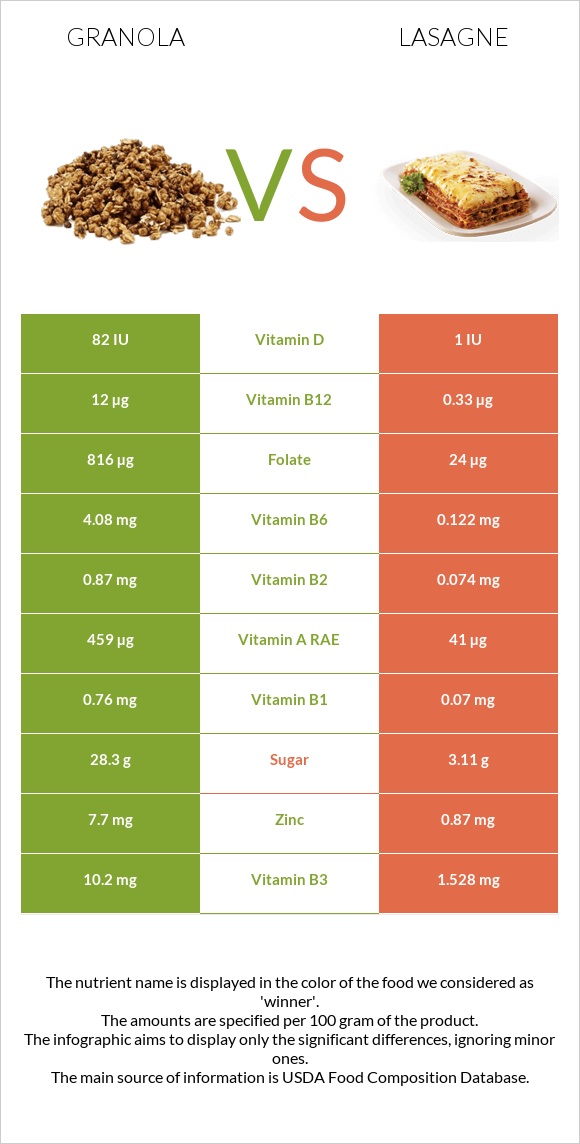
What are the main differences between granola and lasagne? Granola has more vitamin B12, vitamin B6, folate, zinc, vitamin B2, vitamin B1, copper, vitamin B3, iron, and vitamin A than lasagne. Granola's daily need coverage for vitamin B12 is 486% higher. Lasagne has 34 times less folate than granola. Granola has 816µg of folate, while lasagne has 24µg. Granola has a higher glycemic index (53) than lasagne (28). We used Cereals ready-to-eat, KELLOGG, KELLOGG'S Low Fat Granola without Raisins and Lasagna with meat sauce, frozen, prepared types in this comparison.
Infographic
Mineral Comparison
Mineral comparison score is based on the number of minerals by which one or the other food is richer. The "coverage" charts below show how much of the daily needs can be covered by 300 grams of the food.
6
100 g
300 g
0.5 cup (1 NLEA serving) - 49g
Magnesium
Magnesium
Calcium
Calcium
Potassium
Potassium
Iron
Iron
Copper
Copper
Zinc
Zinc
Phosphorus
Phosphorus
Sodium
Sodium
Manganese
Manganese
Selenium
Selenium
49%
9.9%
19%
139%
200%
210%
98%
34%
0%
94%
2
100 g
300 g
1 piece corner - 114g 1 piece side - 123g 1 piece center - 255g
Magnesium
Magnesium
Calcium
Calcium
Potassium
Potassium
Iron
Iron
Copper
Copper
Zinc
Zinc
Phosphorus
Phosphorus
Sodium
Sodium
Manganese
Manganese
Selenium
Selenium
14%
26%
17%
27%
30%
24%
49%
49%
25%
87%
Vitamin Comparison
Vitamin comparison score is based on the number of vitamins by which one or the other food is richer. The "coverage" charts below show how much of the daily needs can be covered by 300 grams of the food.
10
100 g
300 g
0.5 cup (1 NLEA serving) - 49g
Vitamin C
Vit. C
Vitamin D
Vit. D
Vitamin A
Vit. A
Vitamin E
Vit. E
Vitamin B1
Vit. B1
Vitamin B2
Vit. B2
Vitamin B3
Vit. B3
Vitamin B5
Vit. B5
Vitamin B6
Vit. B6
Vitamin B12
Vit. B12
Vitamin K
Vit. K
Folate
Folate
20%
32%
153%
49%
190%
201%
191%
0%
942%
1500%
3.3%
612%
2
100 g
300 g
1 piece corner - 114g 1 piece side - 123g 1 piece center - 255g
Vitamin C
Vit. C
Vitamin D
Vit. D
Vitamin A
Vit. A
Vitamin E
Vit. E
Vitamin B1
Vit. B1
Vitamin B2
Vit. B2
Vitamin B3
Vit. B3
Vitamin B5
Vit. B5
Vitamin B6
Vit. B6
Vitamin B12
Vit. B12
Vitamin K
Vit. K
Folate
Folate
8.3%
0%
14%
17%
18%
17%
29%
19%
28%
41%
18%
18%
All nutrients comparison - raw data values
Nutrient
DV% diff.
Vitamin B12
12µg
0.33µg
486%
Vitamin B6
4.08mg
0.122mg
304%
Folate
816µg
24µg
198%
Zinc
7.7mg
0.87mg
62%
Vitamin B2
0.87mg
0.074mg
61%
Vitamin B1
0.76mg
0.07mg
58%
Copper
0.6mg
0.09mg
57%
Vitamin B3
10.2mg
1.528mg
54%
Vitamin A
459µg
41µg
46%
Iron
3.7mg
0.71mg
37%
Carbs
80.9g
15.36g
22%
Fiber
7g
1.7g
21%
Phosphorus
228mg
115mg
16%
Calories
389kcal
135kcal
13%
Vitamin D
2.1µg
0µg
11%
Magnesium
68mg
20mg
11%
Vitamin E
2.43mg
0.85mg
11%
Vitamin D*
82 IU
1 IU
10%
Manganese
0.193mg
8%
Polyunsaturated fat
1.6g
0.433g
8%
Cholesterol
0mg
17mg
6%
Calcium
33mg
88mg
6%
Vitamin B5
0.323mg
6%
Sodium
257mg
373mg
5%
Vitamin K
1.3µg
7µg
5%
Vitamin C
6mg
2.5mg
4%
Starch
9.83g
4%
Saturated fat
1.39g
2.348g
4%
Protein
8.7g
7.28g
3%
Selenium
17.3µg
15.9µg
3%
Monounsaturated fat
2.5g
1.758g
2%
Fats
5.7g
4.92g
1%
Potassium
215mg
196mg
1%
Fructose
1.04g
1%
Protein per 100 calories
2.2g
5.4g
N/A
Calories per 10 g protein
447kcal
185kcal
N/A
Weight per 100 calories
26g
74g
N/A
Unsaturated / Saturated Fat ratio
2.9
0.93
N/A
Net carbs
73.9g
13.66g
N/A
Sugar
28.3g
3.11g
N/A
Trans fat
0g
0.196g
N/A
Choline
22.6mg
23.2mg
0%
Tryptophan
0.085mg
0%
Threonine
0.219mg
0%
Isoleucine
0.224mg
0%
Leucine
0.578mg
0%
Lysine
0.486mg
0%
Methionine
0.164mg
0%
Phenylalanine
0.329mg
0%
Valine
0.285mg
0%
Histidine
0.183mg
0%
Omega-3 - EPA
0g
0.001g
N/A
Omega-3 - ALA
0.026g
N/A
Omega-3 - DPA
0g
0.003g
N/A
Omega-6 - Dihomo-gamma-linoleic acid
0.006g
N/A
Omega-6 - Eicosadienoic acid
0.005g
N/A
Omega-6 - Linoleic acid
0.322g
N/A
Macronutrient Comparison
Macronutrient breakdown side-by-side comparison
3
9%
6%
81%
4%
Protein:
8.7 g
Fats:
5.7 g
Carbs:
80.9 g
Water:
3.5 g
Other:
1.2 g
2
7%
5%
15%
71%
Protein:
7.28 g
Fats:
4.92 g
Carbs:
15.36 g
Water:
70.87 g
Other:
1.57 g
Contains
more
Protein Protein
+19.5%
Contains
more
Fats Fats
+15.9%
Contains
more
Carbs Carbs
+426.7%
Contains
more
Water Water
+1924.9%
Contains
more
Other Other
+30.8%
Fat Type Comparison
Fat type breakdown side-by-side comparison
3
25%
46%
29%
Saturated fat:
Sat. Fat
1.39 g
Monounsaturated fat:
Mono. Fat
2.5 g
Polyunsaturated fat:
Poly. Fat
1.6 g
0
52%
39%
10%
Saturated fat:
Sat. Fat
2.348 g
Monounsaturated fat:
Mono. Fat
1.758 g
Polyunsaturated fat:
Poly. Fat
0.433 g
Contains
less
Sat. Fat Saturated fat
-40.8%
Contains
more
Mono. Fat Monounsaturated fat
+42.2%
Contains
more
Poly. Fat Polyunsaturated fat
+269.5%