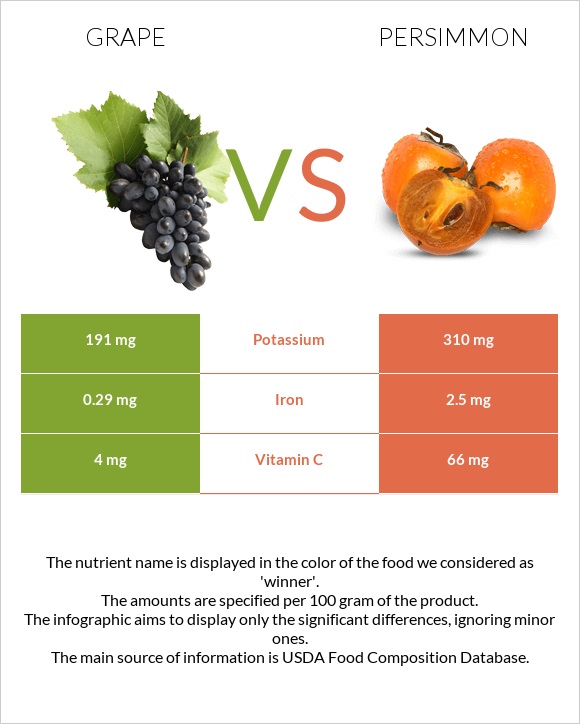
What are the main differences between grapes and persimmon? Grapes have less vitamin C and iron than persimmon. Persimmon's daily need coverage for vitamin C is 69% higher. Grapes have a lower glycemic index than persimmon. We used Grapes, american type (slip skin), raw and Persimmons, native, raw types in this comparison.
Infographic
Mineral Comparison
Mineral comparison score is based on the number of minerals by which one or the other food is richer. The "coverage" charts below show how much of the daily needs can be covered by 300 grams of the food.
5
100 g
300 g
1 grape - 2.4g 1 cup - 92g
Magnesium
Magnesium
Calcium
Calcium
Potassium
Potassium
Iron
Iron
Copper
Copper
Zinc
Zinc
Phosphorus
Phosphorus
Sodium
Sodium
Manganese
Manganese
Selenium
Selenium
3.6%
4.2%
17%
11%
13%
1.1%
4.3%
0.26%
94%
0.55%
5
100 g
300 g
1 fruit without refuse - 25g
Magnesium
Magnesium
Calcium
Calcium
Potassium
Potassium
Iron
Iron
Copper
Copper
Zinc
Zinc
Phosphorus
Phosphorus
Sodium
Sodium
Manganese
Manganese
Selenium
Selenium
0%
8.1%
27%
94%
0%
0%
11%
0.13%
0%
0%
Vitamin Comparison
Vitamin comparison score is based on the number of vitamins by which one or the other food is richer. The "coverage" charts below show how much of the daily needs can be covered by 300 grams of the food.
9
100 g
300 g
1 grape - 2.4g 1 cup - 92g
Vitamin C
Vit. C
Vitamin D
Vit. D
Vitamin A
Vit. A
Vitamin E
Vit. E
Vitamin B1
Vit. B1
Vitamin B2
Vit. B2
Vitamin B3
Vit. B3
Vitamin B5
Vit. B5
Vitamin B6
Vit. B6
Vitamin B12
Vit. B12
Vitamin K
Vit. K
Folate
Folate
13%
0%
1.7%
3.8%
23%
13%
5.6%
1.4%
25%
0%
37%
3%
1
100 g
300 g
1 fruit without refuse - 25g
Vitamin C
Vit. C
Vitamin D
Vit. D
Vitamin A
Vit. A
Vitamin E
Vit. E
Vitamin B1
Vit. B1
Vitamin B2
Vit. B2
Vitamin B3
Vit. B3
Vitamin B5
Vit. B5
Vitamin B6
Vit. B6
Vitamin B12
Vit. B12
Vitamin K
Vit. K
Folate
Folate
220%
0%
0%
0%
0%
0%
0%
0%
0%
0%
0%
0%
All nutrients comparison - raw data values
Nutrient
DV% diff.
Vitamin C
4mg
66mg
69%
Manganese
0.718mg
31%
Iron
0.29mg
2.5mg
28%
Vitamin K
14.6µg
12%
Vitamin B1
0.092mg
8%
Vitamin B6
0.11mg
8%
Carbs
17.15g
33.5g
5%
Potassium
191mg
310mg
4%
Fiber
0.9g
4%
Copper
0.04mg
4%
Vitamin B2
0.057mg
4%
Calories
67kcal
127kcal
3%
Phosphorus
10mg
26mg
2%
Vitamin B3
0.3mg
2%
Magnesium
5mg
1%
Calcium
14mg
27mg
1%
Vitamin A
5µg
1%
Vitamin E
0.19mg
1%
Folate
4µg
1%
Choline
5.6mg
1%
Saturated fat
0.114g
1%
Polyunsaturated fat
0.102g
1%
Protein
0.63g
0.8g
0%
Weight per 100 calories
149g
79g
N/A
Fats
0.35g
0.4g
0%
Net carbs
16.25g
33.5g
N/A
Sugar
16.25g
N/A
Zinc
0.04mg
0%
Sodium
2mg
1mg
0%
Selenium
0.1µg
0%
Vitamin B5
0.024mg
0%
Monounsaturated fat
0.014g
0%
Tryptophan
0.003mg
0.014mg
0%
Threonine
0.017mg
0.041mg
0%
Isoleucine
0.005mg
0.035mg
0%
Leucine
0.013mg
0.058mg
0%
Lysine
0.014mg
0.045mg
0%
Methionine
0.021mg
0.007mg
0%
Phenylalanine
0.013mg
0.036mg
0%
Valine
0.017mg
0.042mg
0%
Histidine
0.023mg
0.016mg
0%
Macronutrient Comparison
Macronutrient breakdown side-by-side comparison
1
17%
81%
Protein:
0.63 g
Fats:
0.35 g
Carbs:
17.15 g
Water:
81.3 g
Other:
0.57 g
4
34%
64%
Protein:
0.8 g
Fats:
0.4 g
Carbs:
33.5 g
Water:
64.4 g
Other:
0.9 g
Contains
more
Water Water
+26.2%
Contains
more
Protein Protein
+27%
Contains
more
Fats Fats
+14.3%
Contains
more
Carbs Carbs
+95.3%
Contains
more
Other Other
+57.9%