Grenadine vs. Apricot jam — In-Depth Nutrition Comparison
Compare
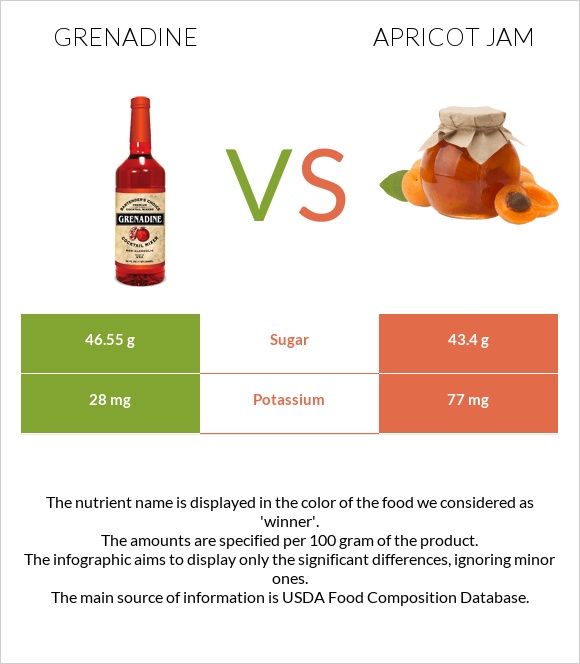
How are grenadine and apricot jam different?
- Apricot jam has more vitamin C, copper, and iron than grenadine.
- Apricot jam has a lower glycemic index (69) than grenadine (100).
Syrups, grenadine and Jams and preserves, apricot are the varieties used in this article.
Infographic
Infographic link
Mineral Comparison
Mineral comparison score is based on the number of minerals by which one or the other food is richer. The "coverage" charts below show how much of the daily needs can be covered by 300 grams of the food.
| Contains more ZincZinc | +116.7% |
| Contains more PhosphorusPhosphorus | +33.3% |
| Contains less SodiumSodium | -32.5% |
| Contains more CalciumCalcium | +233.3% |
| Contains more PotassiumPotassium | +175% |
| Contains more IronIron | +880% |
| Contains more CopperCopper | +284.6% |
| Contains more SeleniumSelenium | +233.3% |
Vitamin Comparison
Vitamin comparison score is based on the number of vitamins by which one or the other food is richer. The "coverage" charts below show how much of the daily needs can be covered by 300 grams of the food.
| Contains more Vitamin CVitamin C | +∞% |
| Contains more Vitamin AVitamin A | +∞% |
| Contains more Vitamin EVitamin E | +∞% |
| Contains more Vitamin B2Vitamin B2 | +120% |
| Contains more Vitamin B3Vitamin B3 | +∞% |
| Contains more Vitamin B6Vitamin B6 | +∞% |
| Contains more FolateFolate | +∞% |
All nutrients comparison - raw data values
| Nutrient |  |
 |
DV% diff. |
| Vitamin C | 0mg | 8.8mg | 10% |
| Copper | 0.026mg | 0.1mg | 8% |
| Iron | 0.05mg | 0.49mg | 6% |
| Selenium | 0.6µg | 2µg | 3% |
| Manganese | 0.04mg | 2% | |
| Vitamin B6 | 0mg | 0.02mg | 2% |
| Calories | 268kcal | 242kcal | 1% |
| Protein | 0g | 0.7g | 1% |
| Carbs | 66.91g | 64.4g | 1% |
| Calcium | 6mg | 20mg | 1% |
| Potassium | 28mg | 77mg | 1% |
| Fiber | 0g | 0.3g | 1% |
| Zinc | 0.13mg | 0.06mg | 1% |
| Sodium | 27mg | 40mg | 1% |
| Vitamin A | 0µg | 10µg | 1% |
| Vitamin E | 0mg | 0.13mg | 1% |
| Vitamin B2 | 0.01mg | 0.022mg | 1% |
| Protein per 100 calories | 0g | 0.2892561983471074g | N/A |
| Calories per 10 g protein | 3457.1428571428573kcal | N/A | |
| Fats | 0g | 0.2g | 0% |
| Net carbs | 66.91g | 64.1g | N/A |
| Magnesium | 4mg | 4mg | 0% |
| Sugar | 46.55g | 43.4g | N/A |
| Phosphorus | 4mg | 3mg | 0% |
| Vitamin B3 | 0mg | 0.036mg | 0% |
| Vitamin B5 | 0.02mg | 0% | |
| Folate | 0µg | 1µg | 0% |
| Choline | 0mg | 0.4mg | 0% |
| Saturated fat | 0g | 0.01g | 0% |
Macronutrient Comparison
Macronutrient breakdown side-by-side comparison
Protein:
0 g
Fats:
0 g
Carbs:
66.91 g
Water:
32.4 g
Other:
0.69 g
Protein:
0.7 g
Fats:
0.2 g
Carbs:
64.4 g
Water:
34.5 g
Other:
0.2 g
| Contains more OtherOther | +245% |
| Contains more ProteinProtein | +∞% |
| Contains more FatsFats | +∞% |
~equal in
Carbs
~64.4g
~equal in
Water
~34.5g


