Grenadine nutrition: calories, carbs, GI, protein, fiber, fats
Carbs in grenadine
This article will discuss grenadine syrup, a concentrate of grenadine (pomegranate) juice.
The total carbs of grenadine are 67g per 100g.
This amount means that 67% of grenadine is made of carbohydrates. In the below chart, we can see the distribution of carbohydrates relative to the distribution of other macronutrients.
Macronutrients chart
Carbs per serving size
The serving size of grenadine is equal to 1tsp, equivalent to 6.7g of grenadine. Thus making the total carbs of grenadine per serving equal to 4.5g of total carbs.
In addition to that, the net carbs in one serving are equal to 4.5g, thus making the total carbs of grenadine equal to its net carbs.
Net carbs in grenadine
Grenadine has a vital characteristic to consider: the total carb content is equal to its net carb content, thus making the net carbs in 100g of grenadine syrup equal to 67g.
Fiber distribution in grenadine
Grenadine contains 0g of fibers.
Comparison to other foods
There are similar syrups that grenadine can be compared to when it comes to their carbohydrate contents. These are examples in the following table.
| Food | Carbohydrates, (per serving) | Carbohydrates, per 100g |
| Grenadine | 4.5g (6.7g) | 67g |
| Chocolate syrup | 10g (20g) | 50g |
| Maple syrup | 55.6g (83g) | 67g |
| Molasses | 15g (20g) | 74.7g |

Top nutrition facts for Grenadine
| Calories ⓘ Calories for selected serving | 268 kcal |
| Glycemic index ⓘ Gi values are taken from various scientific sources. GI values less than 55 are considered as low. Values above 70 are considered as high. | 100 (high) |
| Glycemic load ⓘ Glycemic Load (GL) is a metric that measures both the quality (Glycemic Index) and quantity of carbohydrates in a specific serving of food to estimate its impact on blood sugar levels. It is calculated as: (GI × Carbs in grams) / 100. | 4 (low) |
| Net carbs ⓘ Net Carbs = Total Carbohydrates – Fiber – Sugar Alcohols | 67 g |
| Default serving size ⓘ Serving sizes are mostly taken from FDA's Reference Amounts Customarily Consumed (RACCs) | 1 tsp (6.7 g) |
| Acidity (Based on PRAL) ⓘ PRAL (Potential renal acid load) is calculated using a formula. On the PRAL scale the higher the positive value, the more is the acidifying effect on the body. The lower the negative value, the higher the alkalinity of the food. 0 is neutral. | -0.6 (alkaline) |
Grenadine calories (kcal)
| Calories for different serving sizes of grenadine | Calories | Weight |
|---|---|---|
| Calories in 100 grams | 268 | |
| Calories in 1 tsp | 18 | 6.7 g |
| Calories in 1 tbsp | 54 | 20 g |
| Calories for different varieties of grenadine | Calories | Weight |
|---|---|---|
| Syrups, grenadine (this food) | 268 | 100 g |
| Syrups, malt | 318 | 100 g |
Extra Nutrition facts for Grenadine
| Weight per 100 calories ⓘ Shows how many grams of this food equal 100 kcal—higher grams mean a larger portion for the same calories. | 37 g |
Grenadine Glycemic index (GI)
Grenadine Glycemic load (GL)
Mineral coverage chart
Mineral chart - relative view
Vitamin coverage chart
Vitamin chart - relative view
Fiber content ratio for Grenadine
All nutrients for Grenadine per 100g
| Nutrient | Value | DV% | In TOP % of foods | Comparison |
| Vitamin A | 0µg | 0% | 100% | |
| Calories | 268kcal | 13% | 35% |
5.7 times more than Orange
|
| Protein | 0g | 0% | 100% |
N/A
|
| Weight per 100 calories | 37g | N/A | 66% | |
| Fats | 0g | 0% | 100% |
N/A
|
| Vitamin C | 0mg | 0% | 100% |
N/A
|
| Net carbs | 67g | N/A | 10% |
1.2 times more than Chocolate
|
| Carbs | 67g | 22% | 13% |
2.4 times more than Rice
|
| Cholesterol | 0mg | 0% | 100% |
N/A
|
| Vitamin D | 0µg | 0% | 100% |
N/A
|
| Vitamin D* | 0 IU | 0% | 100% |
N/A
|
| Magnesium | 4mg | 1% | 85% |
35 times less than Almonds
|
| Calcium | 6mg | 1% | 85% |
20.8 times less than Milk
|
| Potassium | 28mg | 1% | 90% |
5.3 times less than Cucumber
|
| Iron | 0.05mg | 1% | 94% |
52 times less than Beef broiled
|
| Sugar | 47g | N/A | 4% |
5.2 times more than Coca-Cola
|
| Fiber | 0g | 0% | 100% |
N/A
|
| Copper | 0.03mg | 3% | 76% |
5.5 times less than Shiitake
|
| Zinc | 0.13mg | 1% | 81% |
48.5 times less than Beef broiled
|
| Phosphorus | 4mg | 1% | 90% |
45.5 times less than Chicken meat
|
| Sodium | 27mg | 1% | 79% |
18.1 times less than White bread
|
| Vitamin E | 0mg | 0% | 100% |
N/A
|
| Selenium | 0.6µg | 1% | 69% | |
| Vitamin B1 | 0mg | 0% | 100% |
N/A
|
| Vitamin B2 | 0.01mg | 1% | 89% |
13 times less than Avocado
|
| Vitamin B3 | 0mg | 0% | 100% |
N/A
|
| Vitamin B6 | 0mg | 0% | 100% |
N/A
|
| Vitamin B12 | 0µg | 0% | 100% |
N/A
|
| Vitamin K | 0µg | 0% | 100% |
N/A
|
| Folate | 0µg | 0% | 100% |
N/A
|
| Saturated fat | 0g | 0% | 100% |
N/A
|
| Choline | 0mg | 0% | 100% | |
| Monounsaturated fat | 0g | N/A | 100% |
N/A
|
| Polyunsaturated fat | 0g | N/A | 100% |
N/A
|
| Caffeine | 0mg | 0% | 100% | |
| Omega-3 - EPA | 0g | N/A | 100% |
N/A
|
| Omega-3 - DHA | 0g | N/A | 100% |
N/A
|
| Omega-3 - DPA | 0g | N/A | 100% |
N/A
|
Check out similar food or compare with current
NUTRITION FACTS LABEL
Serving Size ______________
Health checks
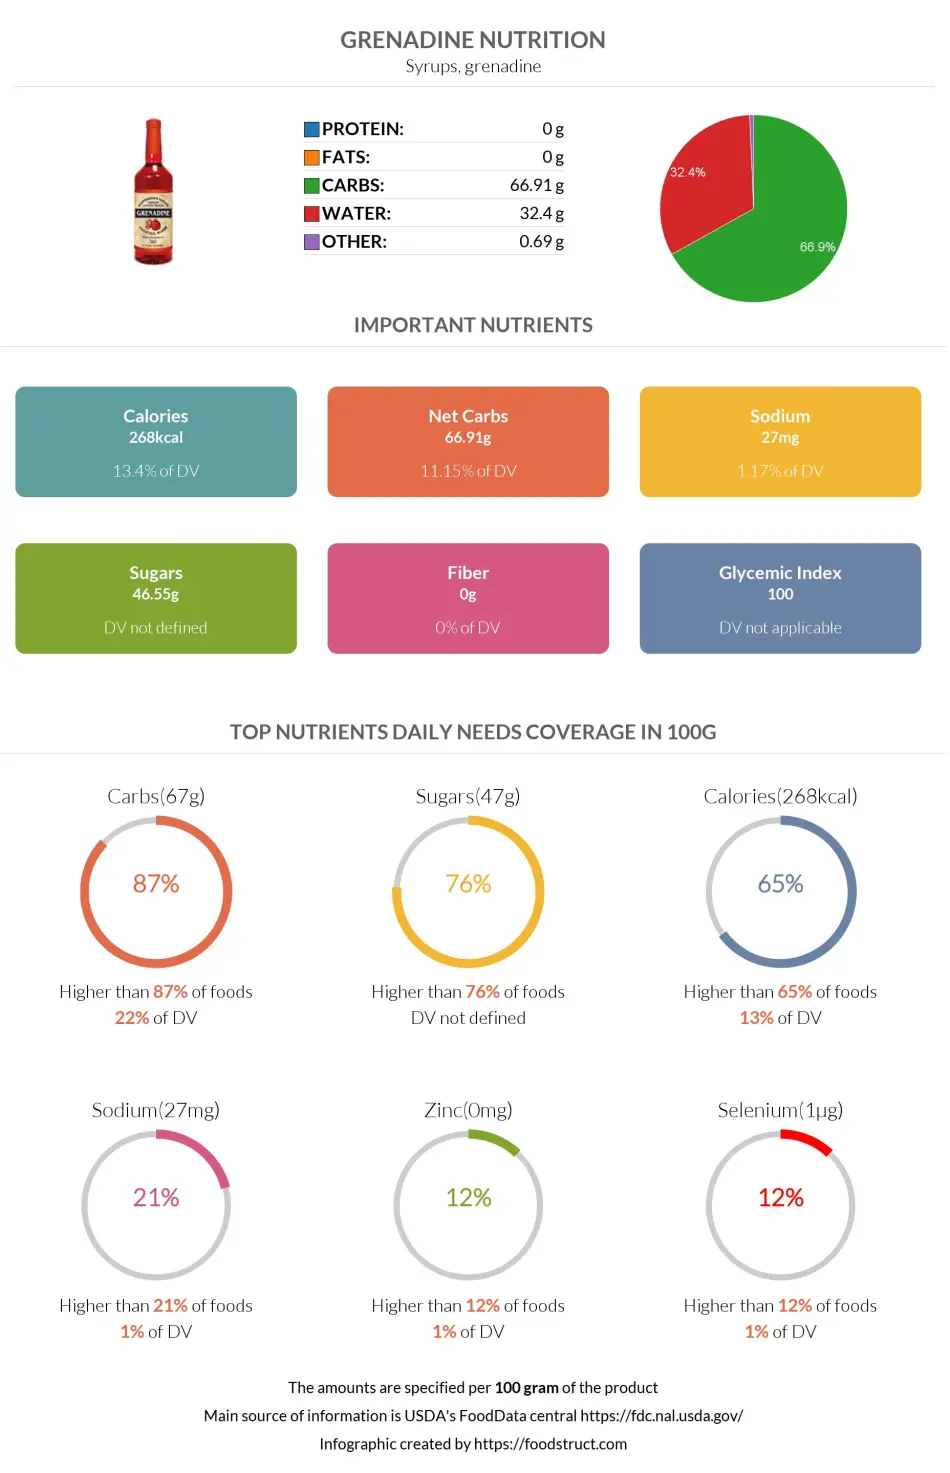
Grenadine nutrition infographic
References
All the values for which the sources are not specified explicitly are taken from FDA’s Food Central. The exact link to the food presented on this page can be found below.