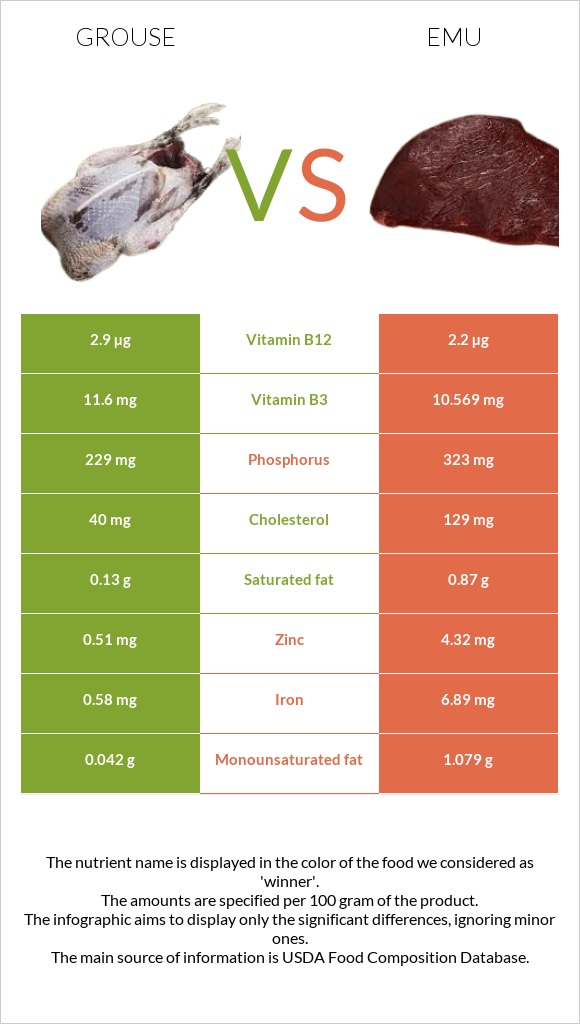
Significant differences between grouse and emu Grouse has more vitamin B12, vitamin B6, and vitamin B3; however, emu is richer in iron, zinc, vitamin B1, vitamin B2, copper, and phosphorus. Emu covers your daily iron needs 79% more than grouse. Grouse contains less cholesterol. Specific food types used in this comparison are Ruffed Grouse, breast meat, skinless, raw and Emu, full rump, cooked, broiled .
Infographic
Mineral Comparison
Mineral comparison score is based on the number of minerals by which one or the other food is richer. The "coverage" charts below show how much of the daily needs can be covered by 300 grams of the food.
1
100 g
300 g
4 oz - 113g 1 breast - 219g 1 bird - 627g
Magnesium
Magnesium
Calcium
Calcium
Potassium
Potassium
Iron
Iron
Copper
Copper
Zinc
Zinc
Phosphorus
Phosphorus
Sodium
Sodium
Manganese
Manganese
Selenium
Selenium
23%
1.5%
27%
22%
19%
14%
98%
6.5%
2.1%
0%
7
100 g
300 g
1 serving ( 3 oz ) - 85g 1 full rump cooked ( yield from 695 g raw meat ) - 496g
Magnesium
Magnesium
Calcium
Calcium
Potassium
Potassium
Iron
Iron
Copper
Copper
Zinc
Zinc
Phosphorus
Phosphorus
Sodium
Sodium
Manganese
Manganese
Selenium
Selenium
24%
2.1%
29%
258%
95%
118%
138%
14%
4.7%
284%
Vitamin Comparison
Vitamin comparison score is based on the number of vitamins by which one or the other food is richer. The "coverage" charts below show how much of the daily needs can be covered by 300 grams of the food.
4
100 g
300 g
4 oz - 113g 1 breast - 219g 1 bird - 627g
Vitamin C
Vit. C
Vitamin D
Vit. D
Vitamin A
Vit. A
Vitamin E
Vit. E
Vitamin B1
Vit. B1
Vitamin B2
Vit. B2
Vitamin B3
Vit. B3
Vitamin B5
Vit. B5
Vitamin B6
Vit. B6
Vitamin B12
Vit. B12
Vitamin K
Vit. K
Folate
Folate
0%
0%
1.7%
15%
11%
65%
218%
0%
294%
363%
0%
0%
4
100 g
300 g
1 serving ( 3 oz ) - 85g 1 full rump cooked ( yield from 695 g raw meat ) - 496g
Vitamin C
Vit. C
Vitamin D
Vit. D
Vitamin A
Vit. A
Vitamin E
Vit. E
Vitamin B1
Vit. B1
Vitamin B2
Vit. B2
Vitamin B3
Vit. B3
Vitamin B5
Vit. B5
Vitamin B6
Vit. B6
Vitamin B12
Vit. B12
Vitamin K
Vit. K
Folate
Folate
0%
0%
1%
5.2%
108%
149%
198%
219%
228%
275%
0%
7.5%
All nutrients comparison - raw data values
Nutrient
DV% diff.
Selenium
52.1µg
95%
Iron
0.58mg
6.89mg
79%
Vitamin B5
3.647mg
73%
Zinc
0.51mg
4.32mg
35%
Vitamin B1
0.042mg
0.43mg
32%
Cholesterol
40mg
129mg
30%
Vitamin B12
2.9µg
2.2µg
29%
Vitamin B2
0.28mg
0.645mg
28%
Copper
0.058mg
0.285mg
25%
Vitamin B6
1.275mg
0.987mg
22%
Protein
25.94g
33.67g
15%
Phosphorus
229mg
323mg
13%
Vitamin B3
11.6mg
10.569mg
6%
Calories
112kcal
168kcal
3%
Fats
0.88g
2.68g
3%
Sodium
50mg
110mg
3%
Vitamin E
0.73mg
0.26mg
3%
Folate
10µg
3%
Saturated fat
0.13g
0.87g
3%
Monounsaturated fat
0.042g
1.079g
3%
Polyunsaturated fat
0.132g
0.613g
3%
Manganese
0.016mg
0.036mg
1%
Protein per 100 calories
23g
20g
N/A
Calories per 10 g protein
43kcal
50kcal
N/A
Weight per 100 calories
89g
60g
N/A
Unsaturated / Saturated Fat ratio
1.3
1.9
N/A
Magnesium
32mg
34mg
0%
Calcium
5mg
7mg
0%
Potassium
311mg
324mg
0%
Vitamin A
5µg
3µg
0%
Tryptophan
0.222mg
0%
Threonine
0.965mg
0%
Isoleucine
1.094mg
0%
Leucine
1.859mg
0%
Lysine
1.981mg
0%
Methionine
0.638mg
0%
Phenylalanine
0.961mg
0%
Valine
1.121mg
0%
Histidine
0.737mg
0%
Omega-3 - EPA
0.003g
0.01g
N/A
Omega-3 - DHA
0.009g
0.015g
N/A
Omega-3 - ALA
0.008g
N/A
Omega-3 - DPA
0.008g
N/A
Omega-6 - Dihomo-gamma-linoleic acid
0.001g
N/A
Omega-6 - Eicosadienoic acid
0.001g
0.003g
N/A
Omega-6 - Linoleic acid
0.071g
N/A
Macronutrient Comparison
Macronutrient breakdown side-by-side comparison
1
26%
73%
Protein:
25.94 g
Fats:
0.88 g
Carbs:
0 g
Water:
72.93 g
Other:
0.25 g
3
34%
3%
62%
2%
Protein:
33.67 g
Fats:
2.68 g
Carbs:
0 g
Water:
61.97 g
Other:
1.68 g
Contains
more
Water Water
+17.7%
Contains
more
Protein Protein
+29.8%
Contains
more
Fats Fats
+204.5%
Contains
more
Other Other
+572%
Fat Type Comparison
Fat type breakdown side-by-side comparison
1
43%
14%
43%
Saturated fat:
Sat. Fat
0.13 g
Monounsaturated fat:
Mono. Fat
0.042 g
Polyunsaturated fat:
Poly. Fat
0.132 g
2
34%
42%
24%
Saturated fat:
Sat. Fat
0.87 g
Monounsaturated fat:
Mono. Fat
1.079 g
Polyunsaturated fat:
Poly. Fat
0.613 g
Contains
less
Sat. Fat Saturated fat
-85.1%
Contains
more
Mono. Fat Monounsaturated fat
+2469%
Contains
more
Poly. Fat Polyunsaturated fat
+364.4%