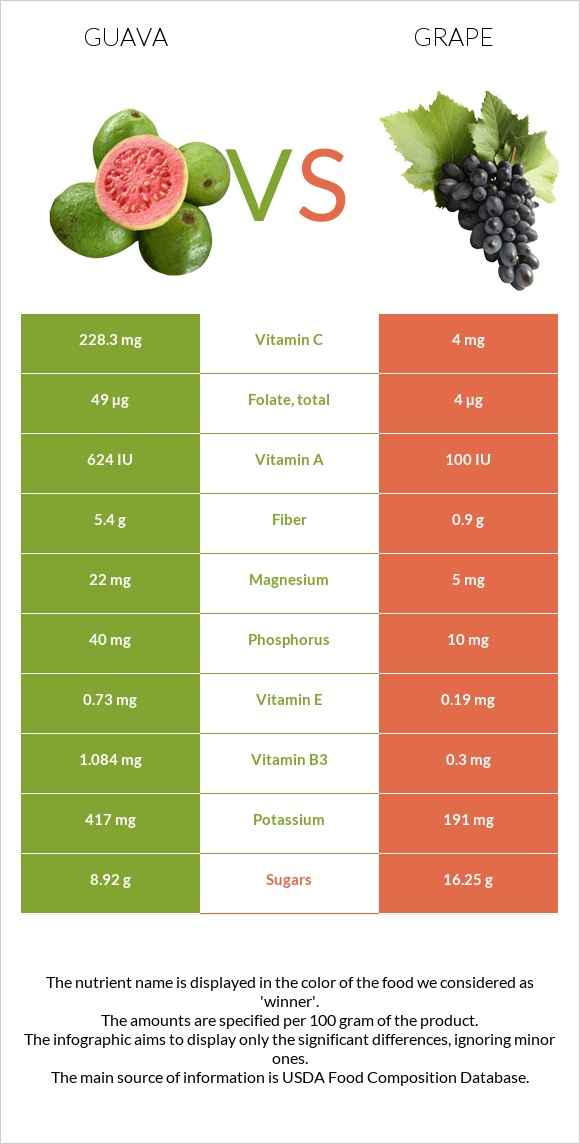
Significant differences between guava and grapes Guava has more vitamin C, copper, fiber, folate, vitamin A, vitamin B5, and potassium; however, grapes are richer in manganese and vitamin K. Guava covers your daily vitamin C needs 249% more than grapes. Grapes have 19 times less vitamin B5 than guava. Guava has 0.451mg of vitamin B5, while grapes have 0.024mg. Grapes have a higher glycemic index. The glycemic index of grapes is 49, while the glycemic index of guava is 31. Specific food types used in this comparison are Guavas, common, raw and Grapes, american type (slip skin), raw .
Infographic
Mineral Comparison
Mineral comparison score is based on the number of minerals by which one or the other food is richer. The "coverage" charts below show how much of the daily needs can be covered by 300 grams of the food.
7
100 g
300 g
1 fruit, without refuse - 55g 1 cup - 165g
Magnesium
Magnesium
Calcium
Calcium
Potassium
Potassium
Iron
Iron
Copper
Copper
Zinc
Zinc
Phosphorus
Phosphorus
Sodium
Sodium
Manganese
Manganese
Selenium
Selenium
16%
5.4%
37%
9.8%
77%
6.3%
17%
0.26%
20%
3.3%
2
100 g
300 g
1 grape - 2.4g 1 cup - 92g
Magnesium
Magnesium
Calcium
Calcium
Potassium
Potassium
Iron
Iron
Copper
Copper
Zinc
Zinc
Phosphorus
Phosphorus
Sodium
Sodium
Manganese
Manganese
Selenium
Selenium
3.6%
4.2%
17%
11%
13%
1.1%
4.3%
0.26%
94%
0.55%
Vitamin Comparison
Vitamin comparison score is based on the number of vitamins by which one or the other food is richer. The "coverage" charts below show how much of the daily needs can be covered by 300 grams of the food.
6
100 g
300 g
1 fruit, without refuse - 55g 1 cup - 165g
Vitamin C
Vit. C
Vitamin D
Vit. D
Vitamin A
Vit. A
Vitamin E
Vit. E
Vitamin B1
Vit. B1
Vitamin B2
Vit. B2
Vitamin B3
Vit. B3
Vitamin B5
Vit. B5
Vitamin B6
Vit. B6
Vitamin B12
Vit. B12
Vitamin K
Vit. K
Folate
Folate
761%
0%
10%
15%
17%
9.2%
20%
27%
25%
0%
6.5%
37%
3
100 g
300 g
1 grape - 2.4g 1 cup - 92g
Vitamin C
Vit. C
Vitamin D
Vit. D
Vitamin A
Vit. A
Vitamin E
Vit. E
Vitamin B1
Vit. B1
Vitamin B2
Vit. B2
Vitamin B3
Vit. B3
Vitamin B5
Vit. B5
Vitamin B6
Vit. B6
Vitamin B12
Vit. B12
Vitamin K
Vit. K
Folate
Folate
13%
0%
1.7%
3.8%
23%
13%
5.6%
1.4%
25%
0%
37%
3%
All nutrients comparison - raw data values
Nutrient
DV% diff.
Vitamin C
228.3mg
4mg
249%
Manganese
0.15mg
0.718mg
25%
Copper
0.23mg
0.04mg
21%
Fiber
5.4g
0.9g
18%
Folate
49µg
4µg
11%
Vitamin K
2.6µg
14.6µg
10%
Vitamin B5
0.451mg
0.024mg
9%
Potassium
417mg
191mg
7%
Vitamin B3
1.084mg
0.3mg
5%
Protein
2.55g
0.63g
4%
Magnesium
22mg
5mg
4%
Phosphorus
40mg
10mg
4%
Vitamin E
0.73mg
0.19mg
4%
Vitamin A
31µg
5µg
3%
Zinc
0.23mg
0.04mg
2%
Vitamin B1
0.067mg
0.092mg
2%
Polyunsaturated fat
0.401g
0.102g
2%
Fats
0.95g
0.35g
1%
Carbs
14.32g
17.15g
1%
Selenium
0.6µg
0.1µg
1%
Vitamin B2
0.04mg
0.057mg
1%
Saturated fat
0.272g
0.114g
1%
Calories
68kcal
67kcal
0%
Protein per 100 calories
3.8g
0.94g
N/A
Calories per 10 g protein
267kcal
1063kcal
N/A
Weight per 100 calories
147g
149g
N/A
Net carbs
8.92g
16.25g
N/A
Calcium
18mg
14mg
0%
Iron
0.26mg
0.29mg
0%
Sugar
8.92g
16.25g
N/A
Sodium
2mg
2mg
0%
Vitamin B6
0.11mg
0.11mg
0%
Choline
7.6mg
5.6mg
0%
Monounsaturated fat
0.087g
0.014g
0%
Tryptophan
0.022mg
0.003mg
0%
Threonine
0.096mg
0.017mg
0%
Isoleucine
0.093mg
0.005mg
0%
Leucine
0.171mg
0.013mg
0%
Lysine
0.072mg
0.014mg
0%
Methionine
0.016mg
0.021mg
0%
Phenylalanine
0.006mg
0.013mg
0%
Valine
0.087mg
0.017mg
0%
Histidine
0.022mg
0.023mg
0%
Macronutrient Comparison
Macronutrient breakdown side-by-side comparison
3
3%
14%
81%
Protein:
2.55 g
Fats:
0.95 g
Carbs:
14.32 g
Water:
80.8 g
Other:
1.38 g
2
17%
81%
Protein:
0.63 g
Fats:
0.35 g
Carbs:
17.15 g
Water:
81.3 g
Other:
0.57 g
Contains
more
Protein Protein
+304.8%
Contains
more
Fats Fats
+171.4%
Contains
more
Other Other
+142.1%
Contains
more
Carbs Carbs
+19.8%
Fat Type Comparison
Fat type breakdown side-by-side comparison
2
36%
11%
53%
Saturated fat:
Sat. Fat
0.272 g
Monounsaturated fat:
Mono. Fat
0.087 g
Polyunsaturated fat:
Poly. Fat
0.401 g
1
50%
6%
44%
Saturated fat:
Sat. Fat
0.114 g
Monounsaturated fat:
Mono. Fat
0.014 g
Polyunsaturated fat:
Poly. Fat
0.102 g
Contains
more
Mono. Fat Monounsaturated fat
+521.4%
Contains
more
Poly. Fat Polyunsaturated fat
+293.1%
Contains
less
Sat. Fat Saturated fat
-58.1%