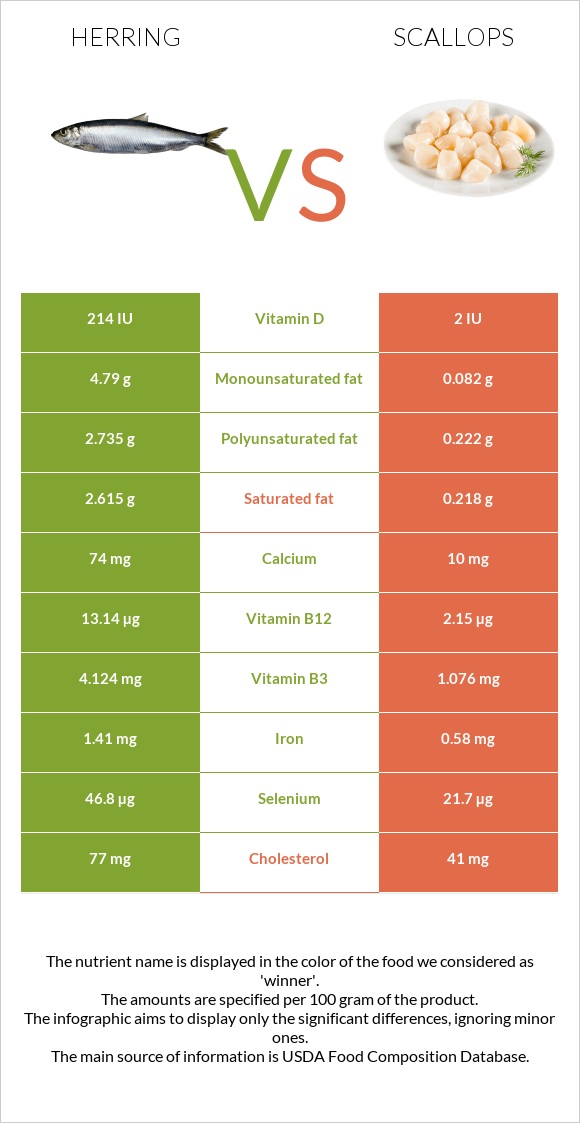
Significant differences between herring and scallops Herring is richer in vitamin B12, selenium, vitamin D*, vitamin B2, vitamin B3, and vitamin B6, while scallops are higher in phosphorus. Herring covers your daily vitamin B12 needs 458% more than scallops. Herring has 107 times more vitamin D* than scallops. Herring has 214 IU of vitamin D*, while scallops have 2 IU. Scallops are lower in saturated fat. Specific food types used in this comparison are Fish, herring, Atlantic, cooked, dry heat and Mollusks, scallop, (bay and sea), cooked, steamed .
Infographic
Mineral Comparison
Mineral comparison score is based on the number of minerals by which one or the other food is richer. The "coverage" charts below show how much of the daily needs can be covered by 300 grams of the food.
7
100 g
300 g
3 oz - 85g 1 fillet - 143g
Magnesium
Magnesium
Calcium
Calcium
Potassium
Potassium
Iron
Iron
Copper
Copper
Zinc
Zinc
Phosphorus
Phosphorus
Sodium
Sodium
Manganese
Manganese
Selenium
Selenium
29%
22%
37%
53%
39%
35%
130%
15%
5.2%
255%
2
100 g
300 g
3 oz - 85g
Magnesium
Magnesium
Calcium
Calcium
Potassium
Potassium
Iron
Iron
Copper
Copper
Zinc
Zinc
Phosphorus
Phosphorus
Sodium
Sodium
Manganese
Manganese
Selenium
Selenium
26%
3%
28%
22%
11%
42%
183%
87%
3.8%
118%
Vitamin Comparison
Vitamin comparison score is based on the number of vitamins by which one or the other food is richer. The "coverage" charts below show how much of the daily needs can be covered by 300 grams of the food.
11
100 g
300 g
3 oz - 85g 1 fillet - 143g
Vitamin C
Vit. C
Vitamin D
Vit. D
Vitamin A
Vit. A
Vitamin E
Vit. E
Vitamin B1
Vit. B1
Vitamin B2
Vit. B2
Vitamin B3
Vit. B3
Vitamin B5
Vit. B5
Vitamin B6
Vit. B6
Vitamin B12
Vit. B12
Vitamin K
Vit. K
Folate
Folate
2.3%
81%
12%
27%
28%
69%
77%
44%
80%
1643%
0.25%
9%
1
100 g
300 g
3 oz - 85g
Vitamin C
Vit. C
Vitamin D
Vit. D
Vitamin A
Vit. A
Vitamin E
Vit. E
Vitamin B1
Vit. B1
Vitamin B2
Vit. B2
Vitamin B3
Vit. B3
Vitamin B5
Vit. B5
Vitamin B6
Vit. B6
Vitamin B12
Vit. B12
Vitamin K
Vit. K
Folate
Folate
0%
0%
0.67%
0%
3%
5.5%
20%
22%
26%
269%
0%
15%
All nutrients comparison - raw data values
Nutrient
DV% diff.
Vitamin B12
13.14µg
2.15µg
458%
Selenium
46.8µg
21.7µg
46%
Vitamin D*
214 IU
2 IU
27%
Vitamin D
5.4µg
0µg
27%
Sodium
115mg
667mg
24%
Vitamin B2
0.299mg
0.024mg
21%
Vitamin B3
4.124mg
1.076mg
19%
Phosphorus
303mg
426mg
18%
Vitamin B6
0.348mg
0.112mg
18%
Fats
11.59g
0.84g
17%
Polyunsaturated fat
2.735g
0.222g
17%
Cholesterol
77mg
41mg
12%
Monounsaturated fat
4.79g
0.082g
12%
Saturated fat
2.615g
0.218g
11%
Iron
1.41mg
0.58mg
10%
Copper
0.118mg
0.033mg
9%
Vitamin E
1.37mg
0mg
9%
Vitamin B1
0.112mg
0.012mg
8%
Vitamin B5
0.74mg
0.366mg
7%
Calcium
74mg
10mg
6%
Calories
203kcal
111kcal
5%
Protein
23.03g
20.54g
5%
Choline
83.3mg
110.7mg
5%
Vitamin A
36µg
2µg
4%
Potassium
419mg
314mg
3%
Zinc
1.27mg
1.55mg
3%
Carbs
0g
5.41g
2%
Starch
3.69g
2%
Folate
12µg
20µg
2%
Vitamin C
0.7mg
0mg
1%
Magnesium
41mg
37mg
1%
Protein per 100 calories
11g
19g
N/A
Calories per 10 g protein
88kcal
54kcal
N/A
Weight per 100 calories
49g
90g
N/A
Unsaturated / Saturated Fat ratio
2.9
1.4
N/A
Net carbs
0g
5.41g
N/A
Manganese
0.04mg
0.029mg
0%
Vitamin K
0.1µg
0µg
0%
Trans fat
0.009g
N/A
Tryptophan
0.258mg
0.173mg
0%
Threonine
1.01mg
0.629mg
0%
Isoleucine
1.061mg
0.692mg
0%
Leucine
1.872mg
1.226mg
0%
Lysine
2.115mg
1.258mg
0%
Methionine
0.682mg
0.487mg
0%
Phenylalanine
0.899mg
0.597mg
0%
Valine
1.187mg
0.645mg
0%
Histidine
0.678mg
0.314mg
0%
Omega-3 - EPA
0.909g
0.072g
N/A
Omega-3 - DHA
1.105g
0.104g
N/A
Omega-3 - DPA
0.071g
0.005g
N/A
Omega-6 - Eicosadienoic acid
0.002g
N/A
Macronutrient Comparison
Macronutrient breakdown side-by-side comparison
2
23%
12%
64%
Protein:
23.03 g
Fats:
11.59 g
Carbs:
0 g
Water:
64.16 g
Other:
1.22 g
3
21%
5%
70%
3%
Protein:
20.54 g
Fats:
0.84 g
Carbs:
5.41 g
Water:
70.25 g
Other:
2.96 g
Contains
more
Protein Protein
+12.1%
Contains
more
Fats Fats
+1279.8%
Contains
more
Carbs Carbs
+∞%
Contains
more
Other Other
+142.6%
Fat Type Comparison
Fat type breakdown side-by-side comparison
2
26%
47%
27%
Saturated fat:
Sat. Fat
2.615 g
Monounsaturated fat:
Mono. Fat
4.79 g
Polyunsaturated fat:
Poly. Fat
2.735 g
1
42%
16%
43%
Saturated fat:
Sat. Fat
0.218 g
Monounsaturated fat:
Mono. Fat
0.082 g
Polyunsaturated fat:
Poly. Fat
0.222 g
Contains
more
Mono. Fat Monounsaturated fat
+5741.5%
Contains
more
Poly. Fat Polyunsaturated fat
+1132%
Contains
less
Sat. Fat Saturated fat
-91.7%