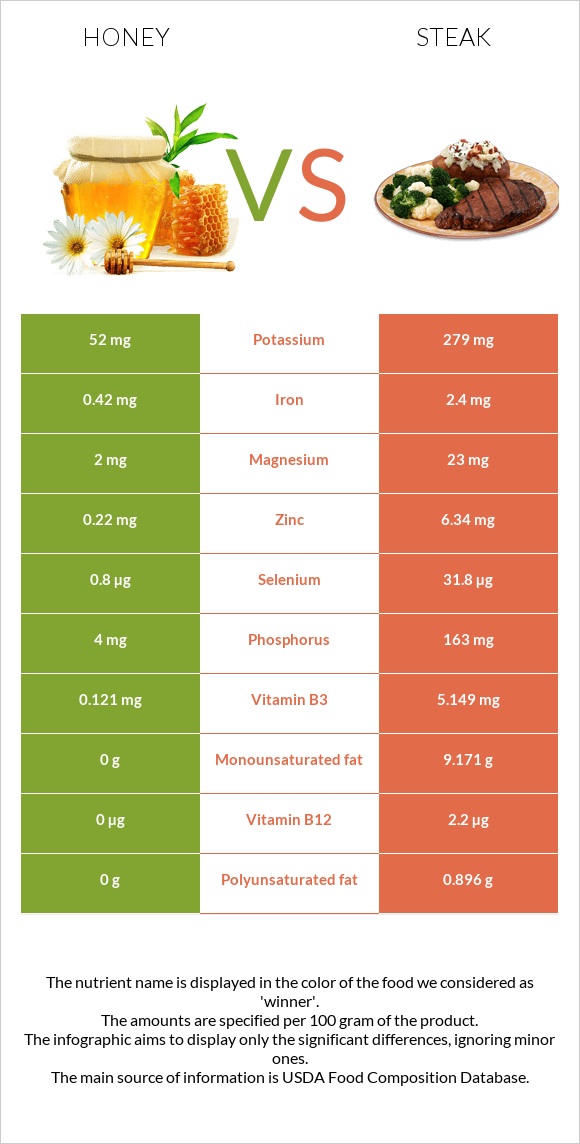
Summary of differences between honey and steak Honey has less vitamin B12, selenium, zinc, vitamin B6, vitamin B3, iron, phosphorus, and vitamin B2 than steak. Steak covers your daily need for vitamin B12, 92% more than honey. The glycemic index of honey is higher. These are the specific foods used in this comparison Honey and Beef, rib eye steak, boneless, lip off, separable lean, and fat, trimmed to 0" fat, all grades, cooked, grilled .
Infographic
Mineral Comparison
Mineral comparison score is based on the number of minerals by which one or the other food is richer. The "coverage" charts below show how much of the daily needs can be covered by 300 grams of the food.
2
100 g
300 g
1 tbsp - 21g 1 cup - 339g
Magnesium
Magnesium
Calcium
Calcium
Potassium
Potassium
Iron
Iron
Copper
Copper
Zinc
Zinc
Phosphorus
Phosphorus
Sodium
Sodium
Manganese
Manganese
Selenium
Selenium
1.4%
1.8%
4.6%
16%
12%
6%
1.7%
0.52%
10%
4.4%
8
100 g
300 g
3 oz - 85g 1 steak - 251g
Magnesium
Magnesium
Calcium
Calcium
Potassium
Potassium
Iron
Iron
Copper
Copper
Zinc
Zinc
Phosphorus
Phosphorus
Sodium
Sodium
Manganese
Manganese
Selenium
Selenium
16%
3.6%
25%
90%
28%
173%
70%
7.6%
0%
173%
Vitamin Comparison
Vitamin comparison score is based on the number of vitamins by which one or the other food is richer. The "coverage" charts below show how much of the daily needs can be covered by 300 grams of the food.
2
100 g
300 g
1 tbsp - 21g 1 cup - 339g
Vitamin C
Vit. C
Vitamin A
Vit. A
Vitamin E
Vit. E
Vitamin D
Vit. D
Vitamin B1
Vit. B1
Vitamin B2
Vit. B2
Vitamin B3
Vit. B3
Vitamin B5
Vit. B5
Vitamin B6
Vit. B6
Vitamin B12
Vit. B12
Vitamin K
Vit. K
Folate
Folate
1.7%
0%
0%
0%
0%
8.8%
2.3%
4.1%
5.5%
0%
0%
1.5%
9
100 g
300 g
3 oz - 85g 1 steak - 251g
Vitamin C
Vit. C
Vitamin A
Vit. A
Vitamin E
Vit. E
Vitamin D
Vit. D
Vitamin B1
Vit. B1
Vitamin B2
Vit. B2
Vitamin B3
Vit. B3
Vitamin B5
Vit. B5
Vitamin B6
Vit. B6
Vitamin B12
Vit. B12
Vitamin K
Vit. K
Folate
Folate
0%
2.3%
0%
1.5%
19%
69%
97%
0%
115%
275%
4%
4.5%
All nutrients comparison - raw data values
Nutrient
DV% diff.
Vitamin B12
0µg
2.2µg
92%
Zinc
0.22mg
6.34mg
56%
Selenium
0.8µg
31.8µg
56%
Fructose
40.94g
51%
Protein
0.3g
24.85g
49%
Saturated fat
0g
8.443g
38%
Vitamin B6
0.024mg
0.5mg
37%
Vitamin B3
0.121mg
5.149mg
31%
Fats
0g
19.02g
29%
Carbs
82.4g
0g
27%
Cholesterol
0mg
78mg
26%
Iron
0.42mg
2.4mg
25%
Phosphorus
4mg
163mg
23%
Monounsaturated fat
0g
9.171g
23%
Vitamin B2
0.038mg
0.301mg
20%
Potassium
52mg
279mg
7%
Vitamin B1
0mg
0.074mg
6%
Polyunsaturated fat
0g
0.896g
6%
Magnesium
2mg
23mg
5%
Copper
0.036mg
0.085mg
5%
Manganese
0.08mg
3%
Calories
304kcal
271kcal
2%
Sodium
4mg
58mg
2%
Vitamin C
0.5mg
0mg
1%
Vitamin D
0 IU
6 IU
1%
Calcium
6mg
12mg
1%
Fiber
0.2g
0g
1%
Vitamin A
0µg
7µg
1%
Vitamin D
0µg
0.1µg
1%
Vitamin B5
0.068mg
1%
Vitamin K
0µg
1.6µg
1%
Folate
2µg
6µg
1%
Net carbs
82.2g
0g
N/A
Sugar
82.12g
0g
N/A
Choline
2.2mg
0%
Tryptophan
0.004mg
0.278mg
0%
Threonine
0.004mg
1.171mg
0%
Isoleucine
0.008mg
1.157mg
0%
Leucine
0.01mg
2.142mg
0%
Lysine
0.008mg
2.38mg
0%
Methionine
0.001mg
0.672mg
0%
Phenylalanine
0.011mg
0.997mg
0%
Valine
0.009mg
1.242mg
0%
Histidine
0.001mg
0.931mg
0%
Omega-3 - EPA
0g
0.001g
N/A
Omega-3 - DHA
0g
0.001g
N/A
Omega-3 - DPA
0g
0.013g
N/A
Macronutrient Comparison
Macronutrient breakdown side-by-side comparison
1
82%
17%
Protein:
0.3 g
Fats:
0 g
Carbs:
82.4 g
Water:
17.1 g
Other:
0.2 g
4
25%
19%
56%
Protein:
24.85 g
Fats:
19.02 g
Carbs:
0 g
Water:
55.59 g
Other:
0.54 g
Contains
more
Carbs Carbs
+∞%
Contains
more
Protein Protein
+8183.3%
Contains
more
Fats Fats
+∞%
Contains
more
Water Water
+225.1%
Contains
more
Other Other
+170%