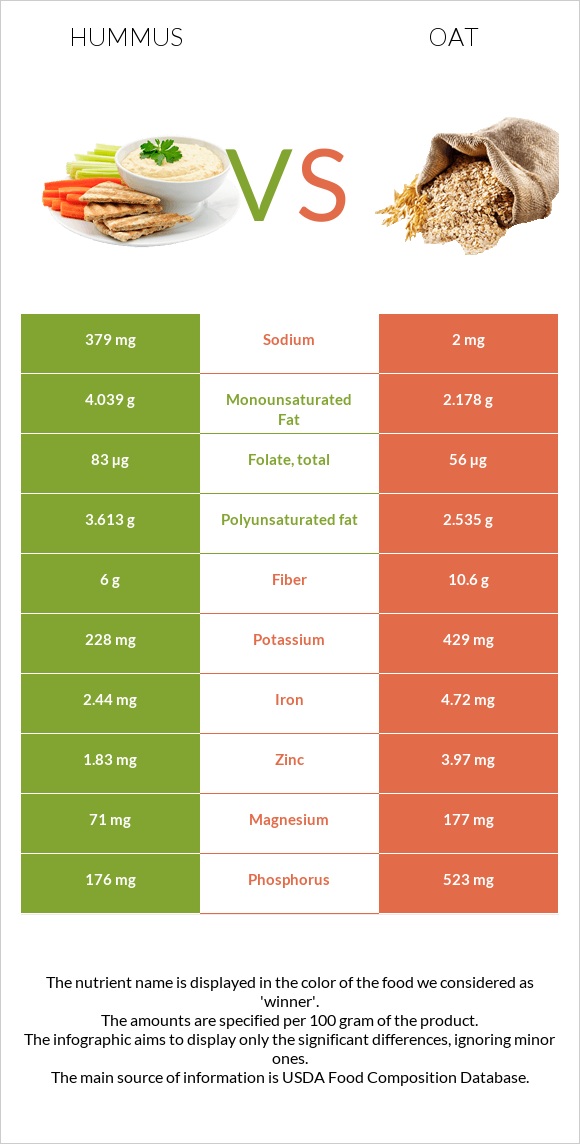
What are the main differences between hummus and oats? Oats have more manganese, phosphorus, vitamin B1, iron, magnesium, vitamin B5, zinc, fiber, and copper than hummus. Oats' daily need coverage for manganese is 180% higher. Oats have 190 times less sodium than hummus. Hummus has 379mg of sodium, while oats have 2mg. Oats have a higher glycemic index (59) than hummus (6). We used Hummus, commercial and Oats types in this comparison.
Infographic
Mineral Comparison
Mineral comparison score is based on the number of minerals by which one or the other food is richer. The "coverage" charts below show how much of the daily needs can be covered by 300 grams of the food.
1
100 g
300 g
1 tbsp - 15g 1 cup - 246g
Magnesium
Magnesium
Calcium
Calcium
Potassium
Potassium
Iron
Iron
Copper
Copper
Zinc
Zinc
Phosphorus
Phosphorus
Sodium
Sodium
Manganese
Manganese
Selenium
Selenium
51%
11%
20%
92%
176%
50%
75%
49%
101%
14%
9
100 g
300 g
1 cup - 156g
Magnesium
Magnesium
Calcium
Calcium
Potassium
Potassium
Iron
Iron
Copper
Copper
Zinc
Zinc
Phosphorus
Phosphorus
Sodium
Sodium
Manganese
Manganese
Selenium
Selenium
126%
16%
38%
177%
209%
108%
224%
0.26%
641%
0%
Vitamin Comparison
Vitamin comparison score is based on the number of vitamins by which one or the other food is richer. The "coverage" charts below show how much of the daily needs can be covered by 300 grams of the food.
2
100 g
300 g
1 tbsp - 15g 1 cup - 246g
Vitamin C
Vit. C
Vitamin D
Vit. D
Vitamin A
Vit. A
Vitamin E
Vit. E
Vitamin B1
Vit. B1
Vitamin B2
Vit. B2
Vitamin B3
Vit. B3
Vitamin B5
Vit. B5
Vitamin B6
Vit. B6
Vitamin B12
Vit. B12
Vitamin K
Vit. K
Folate
Folate
0%
0%
0%
0%
45%
15%
11%
7.9%
46%
0%
0%
62%
4
100 g
300 g
1 cup - 156g
Vitamin C
Vit. C
Vitamin D
Vit. D
Vitamin A
Vit. A
Vitamin E
Vit. E
Vitamin B1
Vit. B1
Vitamin B2
Vit. B2
Vitamin B3
Vit. B3
Vitamin B5
Vit. B5
Vitamin B6
Vit. B6
Vitamin B12
Vit. B12
Vitamin K
Vit. K
Folate
Folate
0%
0%
0%
0%
191%
32%
18%
81%
27%
0%
0%
42%
All nutrients comparison - raw data values
Nutrient
DV% diff.
Manganese
0.773mg
4.916mg
180%
Phosphorus
176mg
523mg
50%
Vitamin B1
0.18mg
0.763mg
49%
Iron
2.44mg
4.72mg
29%
Magnesium
71mg
177mg
25%
Vitamin B5
0.132mg
1.349mg
24%
Zinc
1.83mg
3.97mg
19%
Protein
7.9g
16.89g
18%
Fiber
6g
10.6g
18%
Carbs
14.29g
66.27g
17%
Sodium
379mg
2mg
16%
Calories
166kcal
389kcal
11%
Copper
0.527mg
0.626mg
11%
Folate
83µg
56µg
7%
Polyunsaturated fat
3.613g
2.535g
7%
Potassium
228mg
429mg
6%
Vitamin B2
0.064mg
0.139mg
6%
Vitamin B6
0.2mg
0.119mg
6%
Selenium
2.6µg
5%
Monounsaturated fat
4.039g
2.178g
5%
Fats
9.6g
6.9g
4%
Calcium
38mg
54mg
2%
Vitamin B3
0.582mg
0.961mg
2%
Saturated fat
1.437g
1.217g
1%
Protein per 100 calories
4.8g
4.3g
N/A
Calories per 10 g protein
210kcal
230kcal
N/A
Weight per 100 calories
60g
26g
N/A
Unsaturated / Saturated Fat ratio
5.3
3.9
N/A
Net carbs
8.29g
55.67g
N/A
Tryptophan
0.234mg
0%
Threonine
0.575mg
0%
Isoleucine
0.694mg
0%
Leucine
1.284mg
0%
Lysine
0.701mg
0%
Methionine
0.312mg
0%
Phenylalanine
0.895mg
0%
Valine
0.937mg
0%
Histidine
0.405mg
0%
Macronutrient Comparison
Macronutrient breakdown side-by-side comparison
2
8%
10%
14%
67%
Protein:
7.9 g
Fats:
9.6 g
Carbs:
14.29 g
Water:
66.59 g
Other:
1.62 g
3
17%
7%
66%
8%
2%
Protein:
16.89 g
Fats:
6.9 g
Carbs:
66.27 g
Water:
8.22 g
Other:
1.72 g
Contains
more
Fats Fats
+39.1%
Contains
more
Water Water
+710.1%
Contains
more
Protein Protein
+113.8%
Contains
more
Carbs Carbs
+363.8%
Fat Type Comparison
Fat type breakdown side-by-side comparison
2
16%
44%
40%
Saturated fat:
Sat. Fat
1.437 g
Monounsaturated fat:
Mono. Fat
4.039 g
Polyunsaturated fat:
Poly. Fat
3.613 g
1
21%
37%
43%
Saturated fat:
Sat. Fat
1.217 g
Monounsaturated fat:
Mono. Fat
2.178 g
Polyunsaturated fat:
Poly. Fat
2.535 g
Contains
more
Mono. Fat Monounsaturated fat
+85.4%
Contains
more
Poly. Fat Polyunsaturated fat
+42.5%
Contains
less
Sat. Fat Saturated fat
-15.3%