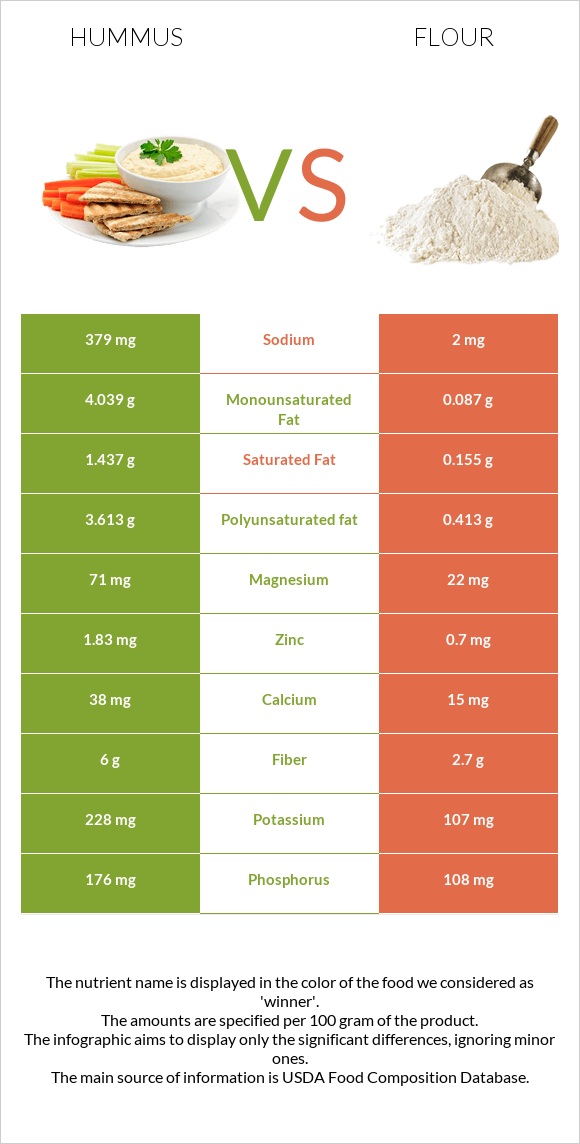
How are hummus and flour different? Hummus is higher in copper, fiber, and vitamin B6; however, flour is richer in selenium, vitamin B1, vitamin B3, vitamin B2, iron, and folate. Daily need coverage for selenium for flour is 57% higher. Hummus contains 190 times more sodium than flour. While hummus contains 379mg of sodium, flour contains only 2mg. Hummus has a lower glycemic index (6) than flour (72). Hummus, commercial and Wheat flour, white, all-purpose, enriched, bleached are the varieties used in this article.
Infographic
Mineral Comparison
Mineral comparison score is based on the number of minerals by which one or the other food is richer. The "coverage" charts below show how much of the daily needs can be covered by 300 grams of the food.
7
100 g
300 g
1 tbsp - 15g 1 cup - 246g
Magnesium
Magnesium
Calcium
Calcium
Potassium
Potassium
Iron
Iron
Copper
Copper
Zinc
Zinc
Phosphorus
Phosphorus
Sodium
Sodium
Manganese
Manganese
Selenium
Selenium
51%
11%
20%
92%
176%
50%
75%
49%
101%
14%
3
100 g
300 g
1 cup - 125g
Magnesium
Magnesium
Calcium
Calcium
Potassium
Potassium
Iron
Iron
Copper
Copper
Zinc
Zinc
Phosphorus
Phosphorus
Sodium
Sodium
Manganese
Manganese
Selenium
Selenium
16%
4.5%
9.4%
174%
48%
19%
46%
0.26%
89%
185%
Vitamin Comparison
Vitamin comparison score is based on the number of vitamins by which one or the other food is richer. The "coverage" charts below show how much of the daily needs can be covered by 300 grams of the food.
1
100 g
300 g
1 tbsp - 15g 1 cup - 246g
Vitamin C
Vit. C
Vitamin D
Vit. D
Vitamin A
Vit. A
Vitamin E
Vit. E
Vitamin B1
Vit. B1
Vitamin B2
Vit. B2
Vitamin B3
Vit. B3
Vitamin B5
Vit. B5
Vitamin B6
Vit. B6
Vitamin B12
Vit. B12
Vitamin K
Vit. K
Folate
Folate
0%
0%
0%
0%
45%
15%
11%
7.9%
46%
0%
0%
62%
7
100 g
300 g
1 cup - 125g
Vitamin C
Vit. C
Vitamin D
Vit. D
Vitamin A
Vit. A
Vitamin E
Vit. E
Vitamin B1
Vit. B1
Vitamin B2
Vit. B2
Vitamin B3
Vit. B3
Vitamin B5
Vit. B5
Vitamin B6
Vit. B6
Vitamin B12
Vit. B12
Vitamin K
Vit. K
Folate
Folate
0%
0%
0%
1.2%
196%
114%
111%
26%
10%
0%
0.75%
137%
All nutrients comparison - raw data values
Nutrient
DV% diff.
Selenium
2.6µg
33.9µg
57%
Vitamin B1
0.18mg
0.785mg
50%
Copper
0.527mg
0.144mg
43%
Vitamin B2
0.064mg
0.494mg
33%
Vitamin B3
0.582mg
5.904mg
33%
Iron
2.44mg
4.64mg
28%
Folate
83µg
183µg
25%
Carbs
14.29g
76.31g
21%
Polyunsaturated fat
3.613g
0.413g
21%
Sodium
379mg
2mg
16%
Fats
9.6g
0.98g
13%
Fiber
6g
2.7g
13%
Magnesium
71mg
22mg
12%
Vitamin B6
0.2mg
0.044mg
12%
Calories
166kcal
364kcal
10%
Zinc
1.83mg
0.7mg
10%
Phosphorus
176mg
108mg
10%
Monounsaturated fat
4.039g
0.087g
10%
Vitamin B5
0.132mg
0.438mg
6%
Saturated fat
1.437g
0.155g
6%
Protein
7.9g
10.33g
5%
Potassium
228mg
107mg
4%
Manganese
0.773mg
0.682mg
4%
Calcium
38mg
15mg
2%
Choline
10.4mg
2%
Protein per 100 calories
4.8g
2.8g
N/A
Calories per 10 g protein
210kcal
352kcal
N/A
Weight per 100 calories
60g
27g
N/A
Unsaturated / Saturated Fat ratio
5.3
3.2
N/A
Net carbs
8.29g
73.61g
N/A
Sugar
0.27g
N/A
Vitamin E
0.06mg
0%
Vitamin K
0.3µg
0%
Tryptophan
0.127mg
0%
Threonine
0.281mg
0%
Isoleucine
0.357mg
0%
Leucine
0.71mg
0%
Lysine
0.228mg
0%
Methionine
0.183mg
0%
Phenylalanine
0.52mg
0%
Valine
0.415mg
0%
Histidine
0.23mg
0%
Macronutrient Comparison
Macronutrient breakdown side-by-side comparison
3
8%
10%
14%
67%
Protein:
7.9 g
Fats:
9.6 g
Carbs:
14.29 g
Water:
66.59 g
Other:
1.62 g
2
10%
76%
12%
Protein:
10.33 g
Fats:
0.98 g
Carbs:
76.31 g
Water:
11.92 g
Other:
0.46 g
Contains
more
Fats Fats
+879.6%
Contains
more
Water Water
+458.6%
Contains
more
Other Other
+252.2%
Contains
more
Protein Protein
+30.8%
Contains
more
Carbs Carbs
+434%
Fat Type Comparison
Fat type breakdown side-by-side comparison
2
16%
44%
40%
Saturated fat:
Sat. Fat
1.437 g
Monounsaturated fat:
Mono. Fat
4.039 g
Polyunsaturated fat:
Poly. Fat
3.613 g
1
24%
13%
63%
Saturated fat:
Sat. Fat
0.155 g
Monounsaturated fat:
Mono. Fat
0.087 g
Polyunsaturated fat:
Poly. Fat
0.413 g
Contains
more
Mono. Fat Monounsaturated fat
+4542.5%
Contains
more
Poly. Fat Polyunsaturated fat
+774.8%
Contains
less
Sat. Fat Saturated fat
-89.2%