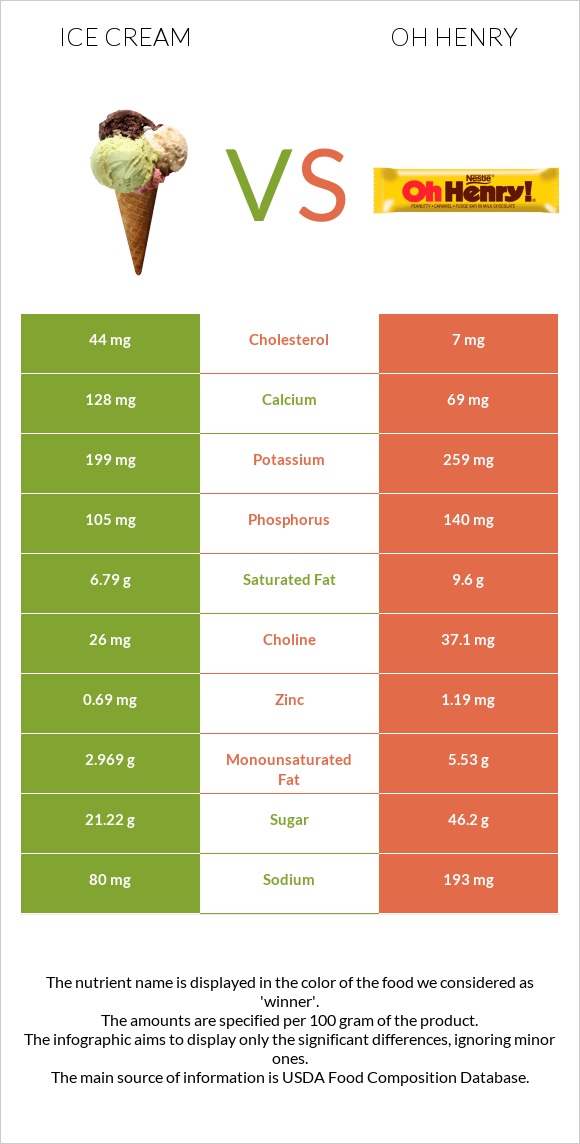
Summary of differences between ice cream and oh henry Ice cream has more vitamin B2; however, oh henry is higher in copper, manganese, vitamin B3, vitamin E, folate, vitamin B1, and magnesium. Oh henry covers your daily need for copper, 37% more than ice cream. Ice cream has 6 times more cholesterol than oh henry. While ice cream has 44mg of cholesterol, oh henry has only 7mg. These are the specific foods used in this comparison Ice creams, vanilla and Candies, NESTLE, OH HENRY! Bar .
Infographic
Mineral Comparison
Mineral comparison score is based on the number of minerals by which one or the other food is richer. The "coverage" charts below show how much of the daily needs can be covered by 300 grams of the food.
2
100 g
300 g
1 serving 1/2 cup - 66g
Magnesium
Magnesium
Calcium
Calcium
Potassium
Potassium
Iron
Iron
Copper
Copper
Zinc
Zinc
Phosphorus
Phosphorus
Sodium
Sodium
Manganese
Manganese
Selenium
Selenium
10%
38%
18%
3.4%
7.7%
19%
45%
10%
1%
9.8%
8
100 g
300 g
1 serving fun size bar - 26g 1 bar 2 oz - 57g
Magnesium
Magnesium
Calcium
Calcium
Potassium
Potassium
Iron
Iron
Copper
Copper
Zinc
Zinc
Phosphorus
Phosphorus
Sodium
Sodium
Manganese
Manganese
Selenium
Selenium
36%
21%
23%
19%
118%
32%
60%
25%
70%
17%
Vitamin Comparison
Vitamin comparison score is based on the number of vitamins by which one or the other food is richer. The "coverage" charts below show how much of the daily needs can be covered by 300 grams of the food.
5
100 g
300 g
1 serving 1/2 cup - 66g
Vitamin C
Vit. C
Vitamin D
Vit. D
Vitamin A
Vit. A
Vitamin E
Vit. E
Vitamin B1
Vit. B1
Vitamin B2
Vit. B2
Vitamin B3
Vit. B3
Vitamin B5
Vit. B5
Vitamin B6
Vit. B6
Vitamin B12
Vit. B12
Vitamin K
Vit. K
Folate
Folate
2%
3%
39%
6%
10%
55%
2.2%
35%
11%
49%
0.75%
3.8%
6
100 g
300 g
1 serving fun size bar - 26g 1 bar 2 oz - 57g
Vitamin C
Vit. C
Vitamin D
Vit. D
Vitamin A
Vit. A
Vitamin E
Vit. E
Vitamin B1
Vit. B1
Vitamin B2
Vit. B2
Vitamin B3
Vit. B3
Vitamin B5
Vit. B5
Vitamin B6
Vit. B6
Vitamin B12
Vit. B12
Vitamin K
Vit. K
Folate
Folate
0%
0%
0%
44%
37%
28%
48%
32%
20%
25%
3%
33%
All nutrients comparison - raw data values
Nutrient
DV% diff.
Copper
0.023mg
0.353mg
37%
Manganese
0.008mg
0.535mg
23%
Fats
11g
23g
18%
Vitamin B3
0.116mg
2.545mg
15%
Polyunsaturated fat
0.452g
2.706g
15%
Carbs
23.6g
65.5g
14%
Calories
207kcal
462kcal
13%
Vitamin A
118µg
0µg
13%
Vitamin E
0.3mg
2.21mg
13%
Saturated fat
6.79g
9.6g
13%
Cholesterol
44mg
7mg
12%
Folate
5µg
44µg
10%
Magnesium
14mg
51mg
9%
Vitamin B1
0.041mg
0.149mg
9%
Vitamin B2
0.24mg
0.121mg
9%
Protein
3.5g
7.7g
8%
Vitamin B12
0.39µg
0.2µg
8%
Calcium
128mg
69mg
6%
Monounsaturated fat
2.969g
5.53g
6%
Iron
0.09mg
0.5mg
5%
Fiber
0.7g
1.9g
5%
Zinc
0.69mg
1.19mg
5%
Phosphorus
105mg
140mg
5%
Sodium
80mg
193mg
5%
Selenium
1.8µg
3.2µg
3%
Vitamin B6
0.048mg
0.086mg
3%
Potassium
199mg
259mg
2%
Choline
26mg
37.1mg
2%
Vitamin C
0.6mg
0mg
1%
Vitamin D*
8 IU
0 IU
1%
Vitamin D
0.2µg
0µg
1%
Vitamin B5
0.581mg
0.539mg
1%
Vitamin K
0.3µg
1.2µg
1%
Caffeine
0mg
4mg
1%
Protein per 100 calories
1.7g
1.7g
N/A
Calories per 10 g protein
591kcal
600kcal
N/A
Weight per 100 calories
48g
22g
N/A
Unsaturated / Saturated Fat ratio
0.5
0.86
N/A
Net carbs
22.9g
63.6g
N/A
Sugar
21.22g
46.2g
N/A
Trans fat
0.05g
N/A
Tryptophan
0.045mg
0%
Threonine
0.146mg
0%
Isoleucine
0.195mg
0%
Leucine
0.316mg
0%
Lysine
0.258mg
0%
Methionine
0.081mg
0%
Phenylalanine
0.157mg
0%
Valine
0.217mg
0%
Histidine
0.088mg
0%
Omega-3 - EPA
0.003g
0g
N/A
Macronutrient Comparison
Macronutrient breakdown side-by-side comparison
1
4%
11%
24%
61%
Protein:
3.5 g
Fats:
11 g
Carbs:
23.6 g
Water:
61 g
Other:
0.9 g
4
8%
23%
66%
2%
Protein:
7.7 g
Fats:
23 g
Carbs:
65.5 g
Water:
2.3 g
Other:
1.5 g
Contains
more
Water Water
+2552.2%
Contains
more
Protein Protein
+120%
Contains
more
Fats Fats
+109.1%
Contains
more
Carbs Carbs
+177.5%
Contains
more
Other Other
+66.7%
Fat Type Comparison
Fat type breakdown side-by-side comparison
1
66%
29%
4%
Saturated fat:
Sat. Fat
6.79 g
Monounsaturated fat:
Mono. Fat
2.969 g
Polyunsaturated fat:
Poly. Fat
0.452 g
2
54%
31%
15%
Saturated fat:
Sat. Fat
9.6 g
Monounsaturated fat:
Mono. Fat
5.53 g
Polyunsaturated fat:
Poly. Fat
2.706 g
Contains
less
Sat. Fat Saturated fat
-29.3%
Contains
more
Mono. Fat Monounsaturated fat
+86.3%
Contains
more
Poly. Fat Polyunsaturated fat
+498.7%