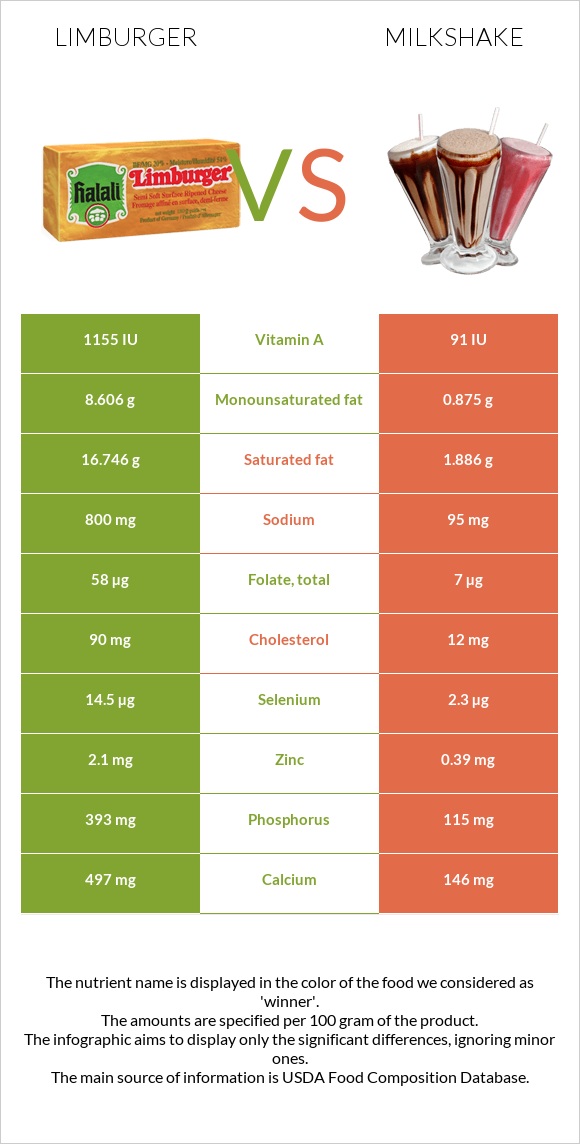
A recap on the differences between Limburger and milkshake Milkshake has less phosphorus, calcium, vitamin B2, selenium, vitamin B12, vitamin A, and vitamin B5. Limburger covers your daily saturated fat needs 74% more than milkshake. Milkshake contains 13 times less vitamin A than Limburger. Limburger contains 1155 IU of vitamin A, while milkshake contains 91 IU. Milkshake has less saturated fat. Food varieties used in this article are Cheese, limburger and Milk shakes, thick vanilla .
Infographic
Mineral Comparison
Mineral comparison score is based on the number of minerals by which one or the other food is richer. The "coverage" charts below show how much of the daily needs can be covered by 300 grams of the food.
7
100 g
300 g
1 cubic inch - 18g 1 oz - 28.35g 1 box - 113g 1 cup - 134g 1 package (8 oz) - 227g
Magnesium
Magnesium
Calcium
Calcium
Potassium
Potassium
Iron
Iron
Copper
Copper
Zinc
Zinc
Phosphorus
Phosphorus
Sodium
Sodium
Manganese
Manganese
Selenium
Selenium
15%
149%
11%
4.9%
7%
57%
168%
104%
5%
79%
3
100 g
300 g
1 fl oz - 28.4g 1 container (11 oz) - 313g
Magnesium
Magnesium
Calcium
Calcium
Potassium
Potassium
Iron
Iron
Copper
Copper
Zinc
Zinc
Phosphorus
Phosphorus
Sodium
Sodium
Manganese
Manganese
Selenium
Selenium
8.6%
44%
16%
3.8%
17%
11%
49%
12%
1.8%
13%
Vitamin Comparison
Vitamin comparison score is based on the number of vitamins by which one or the other food is richer. The "coverage" charts below show how much of the daily needs can be covered by 300 grams of the food.
9
100 g
300 g
1 cubic inch - 18g 1 oz - 28.35g 1 box - 113g 1 cup - 134g 1 package (8 oz) - 227g
Vitamin C
Vit. C
Vitamin D
Vit. D
Vitamin A
Vit. A
Vitamin E
Vit. E
Vitamin B1
Vit. B1
Vitamin B2
Vit. B2
Vitamin B3
Vit. B3
Vitamin B5
Vit. B5
Vitamin B6
Vit. B6
Vitamin B12
Vit. B12
Vitamin K
Vit. K
Folate
Folate
0%
7.5%
113%
4.6%
20%
116%
3%
71%
20%
130%
5.8%
44%
1
100 g
300 g
1 fl oz - 28.4g 1 container (11 oz) - 313g
Vitamin C
Vit. C
Vitamin D
Vit. D
Vitamin A
Vit. A
Vitamin E
Vit. E
Vitamin B1
Vit. B1
Vitamin B2
Vit. B2
Vitamin B3
Vit. B3
Vitamin B5
Vit. B5
Vitamin B6
Vit. B6
Vitamin B12
Vit. B12
Vitamin K
Vit. K
Folate
Folate
0%
18%
8.3%
1%
7.5%
45%
2.7%
22%
9.7%
65%
0.5%
5.3%
All nutrients comparison - raw data values
Nutrient
DV% diff.
Saturated fat
16.746g
1.886g
68%
Phosphorus
393mg
115mg
40%
Fats
27.25g
3.03g
37%
Calcium
497mg
146mg
35%
Vitamin A
340µg
25µg
35%
Protein
20.05g
3.86g
32%
Sodium
800mg
95mg
31%
Cholesterol
90mg
12mg
26%
Vitamin B2
0.503mg
0.195mg
24%
Selenium
14.5µg
2.3µg
22%
Vitamin B12
1.04µg
0.52µg
22%
Monounsaturated fat
8.606g
0.875g
19%
Zinc
2.1mg
0.39mg
16%
Vitamin B5
1.177mg
0.368mg
16%
Folate
58µg
7µg
13%
Calories
327kcal
112kcal
11%
Carbs
0.49g
17.75g
6%
Vitamin D*
20 IU
48 IU
4%
Vitamin D
0.5µg
1.2µg
4%
Vitamin B1
0.08mg
0.03mg
4%
Copper
0.021mg
0.051mg
3%
Vitamin B6
0.086mg
0.042mg
3%
Polyunsaturated fat
0.495g
0.113g
3%
Magnesium
21mg
12mg
2%
Potassium
128mg
183mg
2%
Vitamin K
2.3µg
0.2µg
2%
Vitamin E
0.23mg
0.05mg
1%
Manganese
0.038mg
0.014mg
1%
Protein per 100 calories
6.1g
3.4g
N/A
Calories per 10 g protein
163kcal
290kcal
N/A
Weight per 100 calories
31g
89g
N/A
Unsaturated / Saturated Fat ratio
0.54
0.52
N/A
Net carbs
0.49g
17.75g
N/A
Iron
0.13mg
0.1mg
0%
Sugar
0.49g
17.75g
N/A
Vitamin B3
0.158mg
0.146mg
0%
Choline
15.4mg
14.3mg
0%
Tryptophan
0.289mg
0.054mg
0%
Threonine
0.739mg
0.174mg
0%
Isoleucine
1.219mg
0.234mg
0%
Leucine
2.093mg
0.378mg
0%
Lysine
1.675mg
0.306mg
0%
Methionine
0.619mg
0.097mg
0%
Phenylalanine
1.116mg
0.186mg
0%
Valine
1.439mg
0.258mg
0%
Histidine
0.578mg
0.105mg
0%
Macronutrient Comparison
Macronutrient breakdown side-by-side comparison
3
20%
27%
48%
4%
Protein:
20.05 g
Fats:
27.25 g
Carbs:
0.49 g
Water:
48.42 g
Other:
3.79 g
2
4%
3%
18%
74%
Protein:
3.86 g
Fats:
3.03 g
Carbs:
17.75 g
Water:
74.45 g
Other:
0.91 g
Contains
more
Protein Protein
+419.4%
Contains
more
Fats Fats
+799.3%
Contains
more
Other Other
+316.5%
Contains
more
Carbs Carbs
+3522.4%
Contains
more
Water Water
+53.8%
Fat Type Comparison
Fat type breakdown side-by-side comparison
2
65%
33%
2%
Saturated fat:
Sat. Fat
16.746 g
Monounsaturated fat:
Mono. Fat
8.606 g
Polyunsaturated fat:
Poly. Fat
0.495 g
1
66%
30%
4%
Saturated fat:
Sat. Fat
1.886 g
Monounsaturated fat:
Mono. Fat
0.875 g
Polyunsaturated fat:
Poly. Fat
0.113 g
Contains
more
Mono. Fat Monounsaturated fat
+883.5%
Contains
more
Poly. Fat Polyunsaturated fat
+338.1%
Contains
less
Sat. Fat Saturated fat
-88.7%