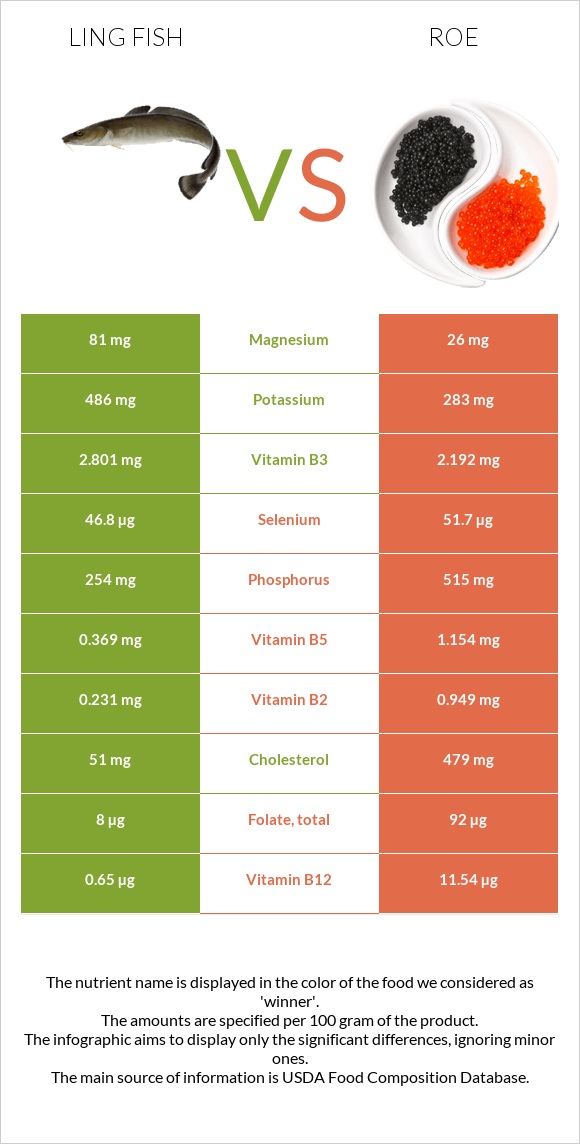
Foodstruct Nutrition Search | Diet Analysis | Food Comparison | Glycemic Index Chart | Insulin Index Chart | Blog | Subscribe | Sign Up

Ling fish vs. Roe — In-Depth Nutrition Comparison

Compare

A recap on differences between Ling fish and Roe

  • Ling fish is higher in Magnesium, and Vitamin B6, yet Roe is higher in Vitamin B12, Vitamin B2, Phosphorus, Folate, Vitamin C, Vitamin B5, and Vitamin B1.
  • Roe covers your daily Vitamin B12 needs 454% more than Ling fish.
  • Ling fish contains 3 times more Magnesium than Roe. While Ling fish contains 81mg of Magnesium, Roe contains only 26mg.
  • The amount of Cholesterol in Ling fish is lower.

Food varieties used in this article are Fish, ling, cooked, dry heat and Fish, roe, mixed species, cooked, dry heat.

Infographic

Ling fish vs Roe infographic
Infographic link

Mineral Comparison

Mineral comparison score is based on the number of minerals by which one or the other food is richer. The "coverage" charts below show how much of the daily needs can be covered by 300 grams of the food.
:
4
Roe
Contains more Calcium +57.1%
Contains more Magnesium +211.5%
Contains more Potassium +71.7%
Contains more Copper +10.2%
Contains more Manganese +192.3%
Contains more Phosphorus +102.8%
Contains less Sodium -32.4%
Contains more Zinc +28%
Contains more Selenium +10.5%
Equal in Iron - 0.77
Equal in Copper - 0.128
Calcium Iron Magnesium Phosphorus Potassium Sodium Zinc Copper Manganese Selenium 14% 32% 58% 109% 43% 23% 28% 47% 5% 256%
Calcium Iron Magnesium Phosphorus Potassium Sodium Zinc Copper Manganese Selenium 9% 29% 19% 221% 25% 16% 35% 43% 2% 282%
Contains more Calcium +57.1%
Contains more Magnesium +211.5%
Contains more Potassium +71.7%
Contains more Copper +10.2%
Contains more Manganese +192.3%
Contains more Phosphorus +102.8%
Contains less Sodium -32.4%
Contains more Zinc +28%
Contains more Selenium +10.5%
Equal in Iron - 0.77
Equal in Copper - 0.128

Vitamin Comparison

Vitamin comparison score is based on the number of vitamins by which one or the other food is richer. The "coverage" charts below show how much of the daily needs can be covered by 300 grams of the food.
:
7
Roe
Contains more Vitamin B3 +27.8%
Contains more Vitamin B6 +89.7%
Contains more Vitamin A +163.5%
Contains more Vitamin C +∞%
Contains more Vitamin B1 +118.1%
Contains more Vitamin B2 +310.8%
Contains more Vitamin B5 +212.7%
Contains more Folate +1050%
Contains more Vitamin B12 +1675.4%
Vitamin A Vitamin E Vitamin D Vitamin C Vitamin B1 Vitamin B2 Vitamin B3 Vitamin B5 Vitamin B6 Folate Vitamin B12 Vitamin K 7% 0% 0% 0% 32% 54% 53% 23% 81% 6% 82% 0%
Vitamin A Vitamin E Vitamin D Vitamin C Vitamin B1 Vitamin B2 Vitamin B3 Vitamin B5 Vitamin B6 Folate Vitamin B12 Vitamin K 19% 0% 0% 55% 70% 219% 42% 70% 43% 69% 1443% 0%
Contains more Vitamin B3 +27.8%
Contains more Vitamin B6 +89.7%
Contains more Vitamin A +163.5%
Contains more Vitamin C +∞%
Contains more Vitamin B1 +118.1%
Contains more Vitamin B2 +310.8%
Contains more Vitamin B5 +212.7%
Contains more Folate +1050%
Contains more Vitamin B12 +1675.4%

Macronutrient Comparison

Macronutrient breakdown side-by-side comparison
:
4
Roe
Contains more Water +26%
Contains more Protein +17.5%
Contains more Fats +903.7%
Contains more Carbs +∞%
Contains more Other +173.7%
24% 74%
Protein: 24.35 g
Fats: 0.82 g
Carbs: 0 g
Water: 73.88 g
Other: 0.95 g
29% 8% 2% 59% 3%
Protein: 28.62 g
Fats: 8.23 g
Carbs: 1.92 g
Water: 58.63 g
Other: 2.6 g
Contains more Water +26%
Contains more Protein +17.5%
Contains more Fats +903.7%
Contains more Carbs +∞%
Contains more Other +173.7%

Comparison summary table

Pay attention to the rightmost column. It displays the amounts side by side, giving a clearer understanding of the difference.
Ling fish Roe
Lower in Sodium ok
Rich in vitamins ok
Lower in Cholesterol ok
Lower in Saturated Fat ok
Lower in Glycemic Index ok
Lower in price ok
Rich in minerals ok
Lower in Sugar Equal

All nutrients comparison - raw data values

Nutrient Ling fish Roe Opinion
Net carbs 0g 1.92g Roe
Protein 24.35g 28.62g Roe
Fats 0.82g 8.23g Roe
Carbs 0g 1.92g Roe
Calories 111kcal 204kcal Roe
Calcium 44mg 28mg Ling fish
Iron 0.83mg 0.77mg Ling fish
Magnesium 81mg 26mg Ling fish
Phosphorus 254mg 515mg Roe
Potassium 486mg 283mg Ling fish
Sodium 173mg 117mg Roe
Zinc 1mg 1.28mg Roe
Copper 0.141mg 0.128mg Ling fish
Manganese 0.038mg 0.013mg Ling fish
Selenium 46.8µg 51.7µg Roe
Vitamin A 115IU 303IU Roe
Vitamin A RAE 35µg 91µg Roe
Vitamin C 0mg 16.4mg Roe
Vitamin B1 0.127mg 0.277mg Roe
Vitamin B2 0.231mg 0.949mg Roe
Vitamin B3 2.801mg 2.192mg Ling fish
Vitamin B5 0.369mg 1.154mg Roe
Vitamin B6 0.351mg 0.185mg Ling fish
Folate 8µg 92µg Roe
Vitamin B12 0.65µg 11.54µg Roe
Tryptophan 0.273mg 0.375mg Roe
Threonine 1.067mg 1.305mg Roe
Isoleucine 1.122mg 1.465mg Roe
Leucine 1.979mg 2.509mg Roe
Lysine 2.236mg 2.179mg Ling fish
Methionine 0.721mg 0.71mg Ling fish
Phenylalanine 0.95mg 1.401mg Roe
Valine 1.254mg 1.676mg Roe
Histidine 0.717mg 0.778mg Roe
Cholesterol 51mg 479mg Ling fish
Saturated Fat 1.866g Ling fish
Omega-3 - DHA 1.747g Roe
Omega-3 - EPA 1.26g Roe
Omega-3 - DPA 0.105g Roe
Monounsaturated Fat 2.129g Roe
Polyunsaturated fat 3.404g Roe

Which food is preferable for your diet?

ok
ok
is better in case of low diet
Ling fish Roe
Low Fats diet ok
Low Carbs diet ok
Low Calories diet ok
Low Glycemic Index diet ok

People also compare

Vitamins & Minerals Daily Need Coverage Score

The summary scores indicate the extent to which this food can fulfill your daily vitamin and mineral requirements if you consume 3 servings, consisting of 100 grams of each (an approximation of 3 serving sizes).
Vitamins Daily Need Coverage Score
28%
Ling fish
169%
Roe
Minerals Daily Need Coverage Score
61%
Ling fish
68%
Roe

Comparison summary

Which food contains less Sodium?
Roe
Roe contains less Sodium (difference - 56mg)
Which food is richer in vitamins?
Roe
Roe is relatively richer in vitamins
Which food is lower in Cholesterol?
Ling fish
Ling fish is lower in Cholesterol (difference - 428mg)
Which food is lower in Saturated Fat?
Ling fish
Ling fish is lower in Saturated Fat (difference - 1.866g)
Which food is lower in glycemic index?
Ling fish
Ling fish is lower in glycemic index (difference - 27)
Which food is cheaper?
Ling fish
Ling fish is cheaper (difference - $100)
Which food is richer in minerals?
Ling fish
Ling fish is relatively richer in minerals
Which food contains less Sugar?
?
The foods are relatively equal in Sugar ( g)

References

All the values for which the sources are not specified explicitly are taken from FDA’s Food Central. The exact link to the food presented on this page can be found below.

  1. Ling fish - https://fdc.nal.usda.gov/fdc-app.html#/food-details/174234/nutrients
  2. Roe - https://fdc.nal.usda.gov/fdc-app.html#/food-details/174239/nutrients

All the Daily Values are presented for males aged 31-50, for 2000-calorie diets.

Data provided by FoodStruct.com should be considered and used as information only. Please consult your physician before beginning any diet.