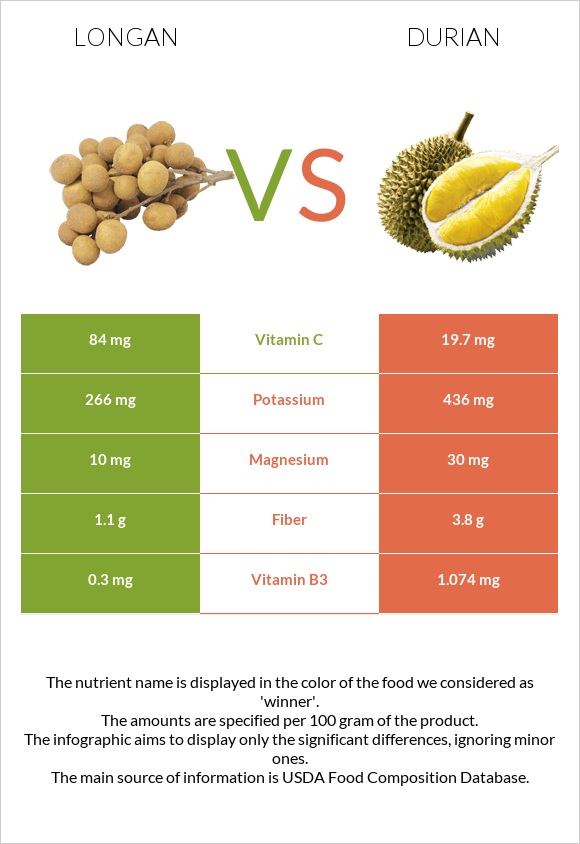
The main differences between longan and durian Longan has more vitamin C; however, durian has more vitamin B1, manganese, and fiber. Daily need coverage for vitamin C for longan is 71% higher. Food types used in this article are Longans, raw and Durian, raw or frozen .
Infographic
Mineral Comparison
Mineral comparison score is based on the number of minerals by which one or the other food is richer. The "coverage" charts below show how much of the daily needs can be covered by 300 grams of the food.
1
100 g
300 g
1 fruit without refuse - 3.2g
Magnesium
Magnesium
Calcium
Calcium
Potassium
Potassium
Iron
Iron
Copper
Copper
Zinc
Zinc
Phosphorus
Phosphorus
Sodium
Sodium
Manganese
Manganese
Selenium
Selenium
7.1%
0.3%
23%
4.9%
56%
1.4%
9%
0%
6.8%
0%
8
100 g
300 g
1 cup, chopped or diced - 243g 1 fruit - 602g
Magnesium
Magnesium
Calcium
Calcium
Potassium
Potassium
Iron
Iron
Copper
Copper
Zinc
Zinc
Phosphorus
Phosphorus
Sodium
Sodium
Manganese
Manganese
Selenium
Selenium
21%
1.8%
38%
16%
69%
7.6%
17%
0.26%
42%
0%
Vitamin Comparison
Vitamin comparison score is based on the number of vitamins by which one or the other food is richer. The "coverage" charts below show how much of the daily needs can be covered by 300 grams of the food.
1
100 g
300 g
1 fruit without refuse - 3.2g
Vitamin C
Vit. C
Vitamin D
Vit. D
Vitamin A
Vit. A
Vitamin E
Vit. E
Vitamin B1
Vit. B1
Vitamin B2
Vit. B2
Vitamin B3
Vit. B3
Vitamin B5
Vit. B5
Vitamin B6
Vit. B6
Vitamin B12
Vit. B12
Vitamin K
Vit. K
Folate
Folate
280%
0%
0%
0%
7.8%
32%
5.6%
0%
0%
0%
0%
0%
7
100 g
300 g
1 cup, chopped or diced - 243g 1 fruit - 602g
Vitamin C
Vit. C
Vitamin D
Vit. D
Vitamin A
Vit. A
Vitamin E
Vit. E
Vitamin B1
Vit. B1
Vitamin B2
Vit. B2
Vitamin B3
Vit. B3
Vitamin B5
Vit. B5
Vitamin B6
Vit. B6
Vitamin B12
Vit. B12
Vitamin K
Vit. K
Folate
Folate
66%
0%
0.67%
0%
94%
46%
20%
14%
73%
0%
0%
27%
All nutrients comparison - raw data values
Nutrient
DV% diff.
Vitamin C
84mg
19.7mg
71%
Vitamin B1
0.031mg
0.374mg
29%
Vitamin B6
0.316mg
24%
Manganese
0.052mg
0.325mg
12%
Fiber
1.1g
3.8g
11%
Folate
36µg
9%
Fats
0.1g
5.33g
8%
Magnesium
10mg
30mg
5%
Potassium
266mg
436mg
5%
Vitamin B2
0.14mg
0.2mg
5%
Vitamin B3
0.3mg
1.074mg
5%
Vitamin B5
0.23mg
5%
Calories
60kcal
147kcal
4%
Carbs
15.14g
27.09g
4%
Iron
0.13mg
0.43mg
4%
Copper
0.169mg
0.207mg
4%
Phosphorus
21mg
39mg
3%
Zinc
0.05mg
0.28mg
2%
Calcium
1mg
6mg
1%
Protein
1.31g
1.47g
0%
Protein per 100 calories
2.2g
1g
N/A
Calories per 10 g protein
458kcal
1000kcal
N/A
Weight per 100 calories
167g
68g
N/A
Net carbs
14.04g
23.29g
N/A
Sodium
0mg
2mg
0%
Vitamin A
2µg
0%
Threonine
0.034mg
0%
Isoleucine
0.026mg
0%
Leucine
0.054mg
0%
Lysine
0.046mg
0%
Methionine
0.013mg
0%
Phenylalanine
0.03mg
0%
Valine
0.058mg
0%
Histidine
0.012mg
0%
Macronutrient Comparison
Macronutrient breakdown side-by-side comparison
1
15%
83%
Protein:
1.31 g
Fats:
0.1 g
Carbs:
15.14 g
Water:
82.75 g
Other:
0.7 g
4
5%
27%
65%
Protein:
1.47 g
Fats:
5.33 g
Carbs:
27.09 g
Water:
64.99 g
Other:
1.12 g
Contains
more
Water Water
+27.3%
Contains
more
Protein Protein
+12.2%
Contains
more
Fats Fats
+5230%
Contains
more
Carbs Carbs
+78.9%
Contains
more
Other Other
+60%