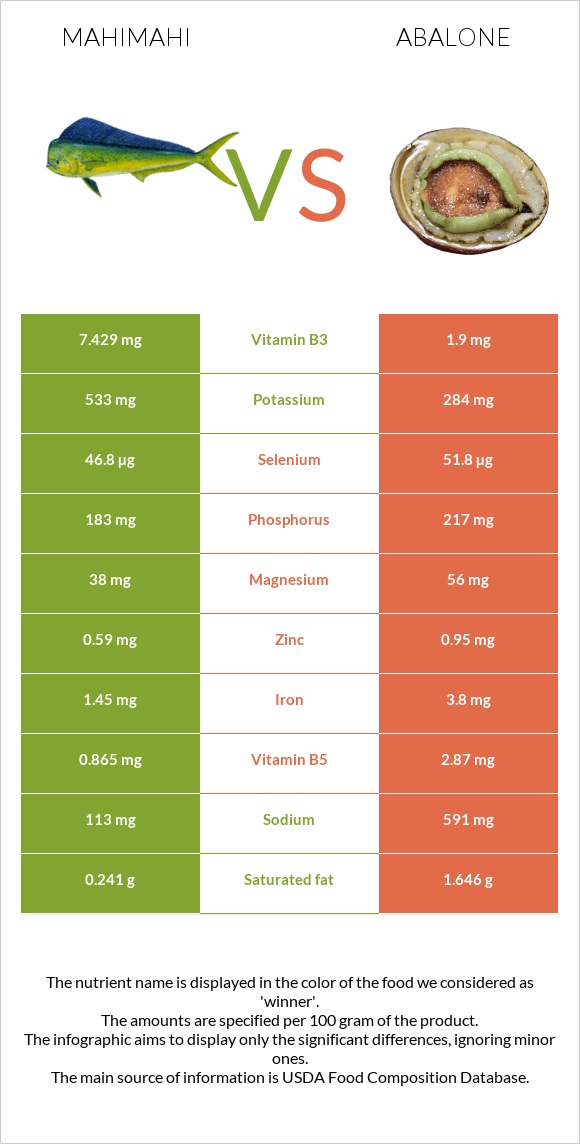
Significant differences between mahimahi and abalone Mahimahi has more vitamin B3, vitamin B6, and potassium; however, abalone is richer in vitamin B5, iron, copper, vitamin B1, and selenium. Abalone covers your daily vitamin B5 needs 40% more than mahimahi. Abalone has 4 times less vitamin B3 than mahimahi. Mahimahi has 7.429mg of vitamin B3, while abalone has 1.9mg. Mahimahi contains less sodium. Specific food types used in this comparison are Fish, mahimahi, cooked, dry heat and Mollusks, abalone, mixed species, cooked, fried .
Infographic
Mineral Comparison
Mineral comparison score is based on the number of minerals by which one or the other food is richer. The "coverage" charts below show how much of the daily needs can be covered by 300 grams of the food.
2
100 g
300 g
3 oz - 85g 1 fillet - 159g
Magnesium
Magnesium
Calcium
Calcium
Potassium
Potassium
Iron
Iron
Copper
Copper
Zinc
Zinc
Phosphorus
Phosphorus
Sodium
Sodium
Manganese
Manganese
Selenium
Selenium
27%
5.7%
47%
54%
18%
16%
78%
15%
2.5%
255%
8
100 g
300 g
3 oz - 85g
Magnesium
Magnesium
Calcium
Calcium
Potassium
Potassium
Iron
Iron
Copper
Copper
Zinc
Zinc
Phosphorus
Phosphorus
Sodium
Sodium
Manganese
Manganese
Selenium
Selenium
40%
11%
25%
143%
76%
26%
93%
77%
9.1%
283%
Vitamin Comparison
Vitamin comparison score is based on the number of vitamins by which one or the other food is richer. The "coverage" charts below show how much of the daily needs can be covered by 300 grams of the food.
3
100 g
300 g
3 oz - 85g 1 fillet - 159g
Vitamin C
Vit. C
Vitamin D
Vit. D
Vitamin A
Vit. A
Vitamin E
Vit. E
Vitamin B1
Vit. B1
Vitamin B2
Vit. B2
Vitamin B3
Vit. B3
Vitamin B5
Vit. B5
Vitamin B6
Vit. B6
Vitamin B12
Vit. B12
Vitamin K
Vit. K
Folate
Folate
0%
0%
21%
0%
5.8%
20%
139%
52%
107%
86%
0%
4.5%
5
100 g
300 g
3 oz - 85g
Vitamin C
Vit. C
Vitamin D
Vit. D
Vitamin A
Vit. A
Vitamin E
Vit. E
Vitamin B1
Vit. B1
Vitamin B2
Vit. B2
Vitamin B3
Vit. B3
Vitamin B5
Vit. B5
Vitamin B6
Vit. B6
Vitamin B12
Vit. B12
Vitamin K
Vit. K
Folate
Folate
6%
0%
0.67%
0%
55%
30%
36%
172%
35%
86%
0%
11%
All nutrients comparison - raw data values
Nutrient
DV% diff.
Vitamin B5
0.865mg
2.87mg
40%
Vitamin B3
7.429mg
1.9mg
35%
Iron
1.45mg
3.8mg
29%
Vitamin B6
0.462mg
0.15mg
24%
Sodium
113mg
591mg
21%
Copper
0.053mg
0.228mg
19%
Vitamin B1
0.023mg
0.22mg
16%
Polyunsaturated fat
0.211g
1.676g
10%
Fats
0.9g
6.78g
9%
Selenium
46.8µg
51.8µg
9%
Protein
23.72g
19.63g
8%
Potassium
533mg
284mg
7%
Vitamin A
62µg
2µg
7%
Saturated fat
0.241g
1.646g
6%
Monounsaturated fat
0.155g
2.741g
6%
Phosphorus
183mg
217mg
5%
Calories
109kcal
189kcal
4%
Carbs
0g
11.05g
4%
Magnesium
38mg
56mg
4%
Zinc
0.59mg
0.95mg
3%
Vitamin B2
0.085mg
0.13mg
3%
Vitamin C
0mg
1.8mg
2%
Calcium
19mg
37mg
2%
Manganese
0.019mg
0.07mg
2%
Folate
6µg
14µg
2%
Protein per 100 calories
22g
10g
N/A
Calories per 10 g protein
46kcal
96kcal
N/A
Weight per 100 calories
92g
53g
N/A
Unsaturated / Saturated Fat ratio
1.5
2.7
N/A
Net carbs
0g
11.05g
N/A
Cholesterol
94mg
94mg
0%
Vitamin B12
0.69µg
0.69µg
0%
Tryptophan
0.266mg
0.224mg
0%
Threonine
1.04mg
0.838mg
0%
Isoleucine
1.093mg
0.854mg
0%
Leucine
1.928mg
1.386mg
0%
Lysine
2.178mg
1.433mg
0%
Methionine
0.702mg
0.441mg
0%
Phenylalanine
0.926mg
0.715mg
0%
Valine
1.222mg
0.86mg
0%
Histidine
0.698mg
0.378mg
0%
Omega-3 - EPA
0.026g
0.054g
N/A
Omega-3 - DHA
0.113g
N/A
Omega-3 - DPA
0.012g
0.046g
N/A
Macronutrient Comparison
Macronutrient breakdown side-by-side comparison
3
24%
71%
4%
Protein:
23.72 g
Fats:
0.9 g
Carbs:
0 g
Water:
71.22 g
Other:
4.16 g
2
20%
7%
11%
60%
2%
Protein:
19.63 g
Fats:
6.78 g
Carbs:
11.05 g
Water:
60.1 g
Other:
2.44 g
Contains
more
Protein Protein
+20.8%
Contains
more
Water Water
+18.5%
Contains
more
Other Other
+70.5%
Contains
more
Fats Fats
+653.3%
Contains
more
Carbs Carbs
+∞%
Fat Type Comparison
Fat type breakdown side-by-side comparison
1
40%
26%
35%
Saturated fat:
Sat. Fat
0.241 g
Monounsaturated fat:
Mono. Fat
0.155 g
Polyunsaturated fat:
Poly. Fat
0.211 g
2
27%
45%
28%
Saturated fat:
Sat. Fat
1.646 g
Monounsaturated fat:
Mono. Fat
2.741 g
Polyunsaturated fat:
Poly. Fat
1.676 g
Contains
less
Sat. Fat Saturated fat
-85.4%
Contains
more
Mono. Fat Monounsaturated fat
+1668.4%
Contains
more
Poly. Fat Polyunsaturated fat
+694.3%