Marinara sauce vs. Tomato sauce — Health Impact and Nutrition Comparison


Summary
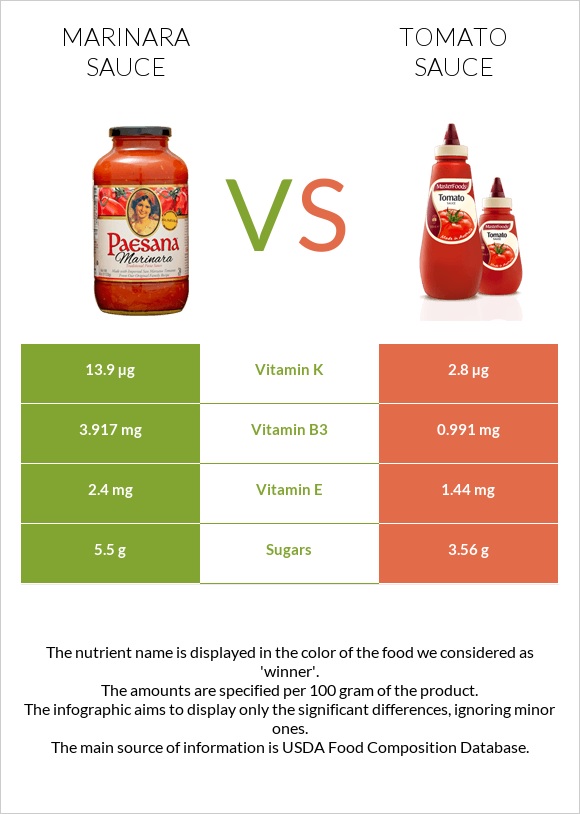
The marinara sauce contains more Vitamin B3, Vitamin B6, Vitamin K, Vitamin E, Vitamin A, calcium, and magnesium than tomato sauce. On the other hand, tomato sauce provides more Vitamin C, iron, and copper.
Introduction
Marinara and tomato sauce are tomato-based sauces that are used worldwide.
In this article, we will compare them to one another according to their general differences, nutritional content, and health impacts.
What's The Actual Difference?
The marinara sauce is more complex when it comes to taste and preparation, containing tomatoes, herbs, spices, garlic, onions, and some optional ingredients such as capers and olives. It can be used for various purposes, from simple dips to pasta sauces. Marinara sauce is very aromatic.
Tomato sauce can refer to various sauces made primarily of tomatoes that are typically served as part of a dish rather than as a condiment. Tomato sauces are commonly used with meat and vegetables, but they are perhaps best known as the foundation for sauces for Mexican salsas and Italian pasta dishes.
The main difference is that marinara is a simple sauce made with garlic, crushed red pepper, and basil that takes about an hour to prepare. In contrast, tomato sauce is thick, rich, and complex. It takes hours to make. Tomato sauce typically contains additional ingredients, such as vegetables and salt pork.
You can read about pizza sauce vs. marinara sauce in this article.
Nutrition
In this comparison, we will use low-sodium marinara sauce and no-salt tomato sauce.
It is important to note that each person can prepare these sauces in their own way when it comes to homemade sauces. Thus, the nutritional compositions can vary. Someone can add more olive oil or salt, and this will eventually affect their nutritional composition and, ultimately, their health impacts.
Calories
The marinara sauce has two times more calories than tomato sauce.
The marinara sauce has 51 calories per 100 g, while tomato sauce has 24 calories per 100 g. However, they are low-calorie sauces.
Minerals
The marinara sauce has more calcium, phosphorus, and magnesium than tomato sauce. However, it's not significantly higher, or high in general.
On the other hand, tomato sauce contains more iron and copper.
Mineral Comparison
Contains
more
MagnesiumMagnesium
+20%
Contains
more
CalciumCalcium
+92.9%
Contains
more
PhosphorusPhosphorus
+25.9%
Contains
more
ManganeseManganese
+21.2%
Contains
more
SeleniumSelenium
+83.3%
Contains
more
IronIron
+23.1%
Contains
more
CopperCopper
+42%
Contains
less
SodiumSodium
-63.3%
Vitamins
The marinara sauce provides more Vitamin E, Vitamin K, Vitamin A, Vitamin B3, and Vitamin B6 than tomato sauce.
On the other hand, tomato sauce contains more Vitamin C.
Vitamin Comparison
Contains
more
Vitamin AVitamin A
+50%
Contains
more
Vitamin EVitamin E
+66.7%
Contains
more
Vitamin B3Vitamin B3
+295.3%
Contains
more
Vitamin B6Vitamin B6
+76.5%
Contains
more
Vitamin KVitamin K
+396.4%
Contains
more
FolateFolate
+44.4%
Contains
more
Vitamin CVitamin C
+250%
Glycemic index
The glycemic index of tomato sauce is equal to 31, while the glycemic index of marinara sauce is not exactly pinpointed; however, it is a low glycemic index sauce.
Fats
Their fat content is negligible, but if we add olive oil, butter, or other types of fats, the fat content will vary significantly.
Carbs
The level of carbs in marinara is higher than in tomato sauce. It contains 8.06 g of carbs, whereas tomato sauce has 5.3g of carbs per 100g.
Health Impact
Since tomato and marinara sauces are used in preparing other foods, it is more important to consider their health implications in their applications.
Weight loss
Tomato and marinara sauce can be used for weight loss diets as they are low in calories. They won't be the reason for any extra calories, and the plus side of these sauces is the edge of flavor they provide. However, since tomato sauce contains fewer calories and fats than marinara, it is a better choice in low-calorie and low-fat diets.
Since these sauces have a moderate amount of net carbs, it is better to avoid them on Keto and Atkins Diet.
Vegans can eat both a marinara sauce and a tomato sauce [1,2].
References
- https://www.ncbi.nlm.nih.gov/pmc/articles/PMC3945587/
- https://www.ncbi.nlm.nih.gov/pmc/articles/PMC7999488/

Infographic
All nutrients comparison - raw data values
| Nutrient | |
|
DV% diff. |
| Vitamin B3 | 3.917mg | 0.991mg | 18% |
| Vitamin K | 13.9µg | 2.8µg | 9% |
| Vitamin C | 2mg | 7mg | 6% |
| Vitamin E | 2.4mg | 1.44mg | 6% |
| Vitamin B5 | 0.309mg | 6% | |
| Vitamin B6 | 0.173mg | 0.098mg | 6% |
| Copper | 0.081mg | 0.115mg | 4% |
| Polyunsaturated fat | 0.508g | 0.121g | 3% |
| Fats | 1.48g | 0.3g | 2% |
| Iron | 0.78mg | 0.96mg | 2% |
| Fructose | 1.67g | 2% | |
| Calories | 51kcal | 24kcal | 1% |
| Carbs | 8.06g | 5.31g | 1% |
| Cholesterol | 2mg | 0mg | 1% |
| Magnesium | 18mg | 15mg | 1% |
| Calcium | 27mg | 14mg | 1% |
| Potassium | 319mg | 297mg | 1% |
| Fiber | 1.8g | 1.5g | 1% |
| Phosphorus | 34mg | 27mg | 1% |
| Sodium | 30mg | 11mg | 1% |
| Vitamin A | 33µg | 22µg | 1% |
| Manganese | 0.137mg | 0.113mg | 1% |
| Selenium | 1.1µg | 0.6µg | 1% |
| Folate | 13µg | 9µg | 1% |
| Choline | 13.7mg | 9.9mg | 1% |
| Saturated fat | 0.17g | 0.041g | 1% |
| Monounsaturated fat | 0.377g | 0.044g | 1% |
| Protein | 1.41g | 1.2g | 0% |
| Protein per 100 calories | 2.8g | 5g | N/A |
| Calories per 10 g protein | 362kcal | 200kcal | N/A |
| Weight per 100 calories | 196g | 417g | N/A |
| Net carbs | 6.26g | 3.81g | N/A |
| Sugar | 5.5g | 3.56g | N/A |
| Zinc | 0.2mg | 0.22mg | 0% |
| Vitamin B1 | 0.024mg | 0.024mg | 0% |
| Vitamin B2 | 0.061mg | 0.065mg | 0% |
| Tryptophan | 0.009mg | 0% | |
| Threonine | 0.037mg | 0% | |
| Isoleucine | 0.025mg | 0% | |
| Leucine | 0.034mg | 0% | |
| Lysine | 0.037mg | 0% | |
| Methionine | 0.008mg | 0% | |
| Phenylalanine | 0.036mg | 0% | |
| Valine | 0.025mg | 0% | |
| Histidine | 0.02mg | 0% |
Macronutrient Comparison
| Contains more ProteinProtein | +17.5% |
| Contains more FatsFats | +393.3% |
| Contains more CarbsCarbs | +51.8% |
| Contains more OtherOther | +15.1% |
Fat Type Comparison
| Contains more Mono. FatMonounsaturated fat | +756.8% |
| Contains more Poly. FatPolyunsaturated fat | +319.8% |
| Contains less Sat. FatSaturated fat | -75.9% |
People also compare


References
All the values for which the sources are not specified explicitly are taken from FDA’s Food Central. The exact link to the food presented on this page can be found below.
- Marinara sauce - https://fdc.nal.usda.gov/fdc-app.html#/food-details/171597/nutrients
- Tomato sauce - https://fdc.nal.usda.gov/fdc-app.html#/food-details/169074/nutrients
All the Daily Values are presented for males aged 31-50, for 2000-calorie diets.