Milk vs. Hot and sour soup — In-Depth Nutrition Comparison
Compare
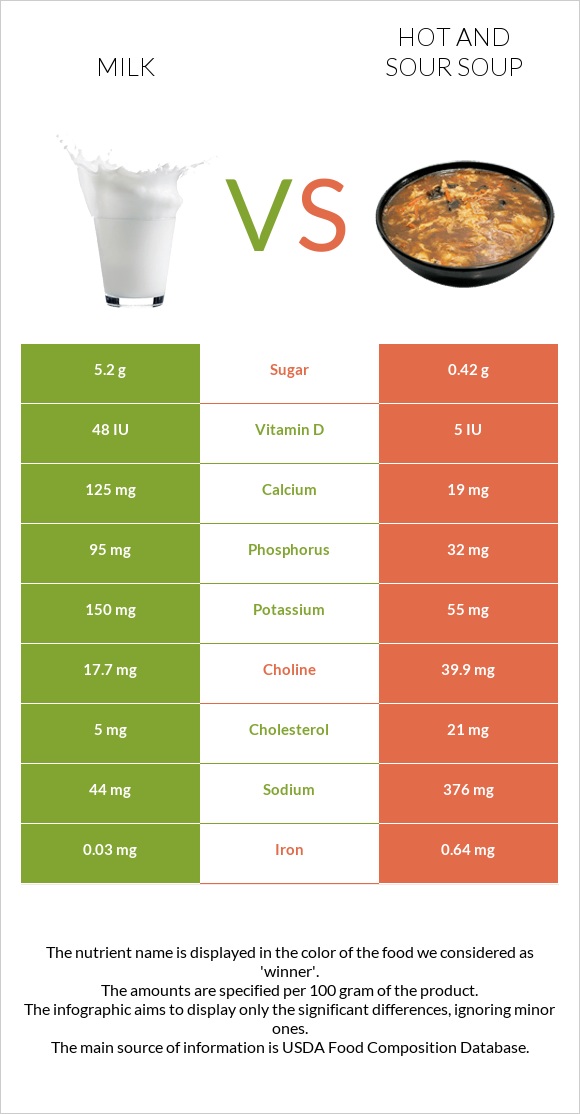
Summary of differences between milk and hot and sour soup
- Milk has more vitamin B12, vitamin B2, calcium, phosphorus, vitamin D, and selenium, while hot, and sour soup has more iron.
- Milk covers your daily need for vitamin B12, 15% more than hot and sour soup.
- Milk contains 10 times more vitamin D than hot and sour soup. While milk contains 48 IU of vitamin D, hot, and sour soup contains only 5 IU.
- The amount of cholesterol in milk is lower.
These are the specific foods used in this comparison Milk, lowfat, fluid, 1% milkfat, with added vitamin A and vitamin D and Soup, hot, and sour, Chinese restaurant.
Infographic
Infographic link
Mineral Comparison
Mineral comparison score is based on the number of minerals by which one or the other food is richer. The "coverage" charts below show how much of the daily needs can be covered by 300 grams of the food.
| Contains more MagnesiumMagnesium | +22.2% |
| Contains more CalciumCalcium | +557.9% |
| Contains more PotassiumPotassium | +172.7% |
| Contains more ZincZinc | +90.9% |
| Contains more PhosphorusPhosphorus | +196.9% |
| Contains less SodiumSodium | -88.3% |
| Contains more SeleniumSelenium | +725% |
| Contains more IronIron | +2033.3% |
| Contains more CopperCopper | +160% |
| Contains more ManganeseManganese | +2733.3% |
Vitamin Comparison
Vitamin comparison score is based on the number of vitamins by which one or the other food is richer. The "coverage" charts below show how much of the daily needs can be covered by 300 grams of the food.
| Contains more Vitamin AVitamin A | +544.4% |
| Contains more Vitamin DVitamin D | +1100% |
| Contains more Vitamin B2Vitamin B2 | +496.8% |
| Contains more Vitamin B5Vitamin B5 | +59% |
| Contains more Vitamin B12Vitamin B12 | +370% |
| Contains more Vitamin EVitamin E | +3800% |
| Contains more Vitamin B1Vitamin B1 | +30% |
| Contains more Vitamin B3Vitamin B3 | +445.2% |
| Contains more Vitamin B6Vitamin B6 | +73% |
| Contains more Vitamin KVitamin K | +1000% |
| Contains more FolateFolate | +60% |
All nutrients comparison - raw data values
| Nutrient |  |
 |
DV% diff. |
| Vitamin B12 | 0.47µg | 0.1µg | 15% |
| Sodium | 44mg | 376mg | 14% |
| Vitamin B2 | 0.185mg | 0.031mg | 12% |
| Calcium | 125mg | 19mg | 11% |
| Phosphorus | 95mg | 32mg | 9% |
| Iron | 0.03mg | 0.64mg | 8% |
| Lysine | 0.282mg | 153mg | 7% |
| Vitamin D | 1.2µg | 0.1µg | 6% |
| Cholesterol | 5mg | 21mg | 5% |
| Vitamin D | 48 IU | 5 IU | 5% |
| Vitamin A | 58µg | 9µg | 5% |
| Selenium | 3.3µg | 0.4µg | 5% |
| Manganese | 0.003mg | 0.085mg | 4% |
| Choline | 17.7mg | 39.9mg | 4% |
| Potassium | 150mg | 55mg | 3% |
| Vitamin E | 0.01mg | 0.39mg | 3% |
| Vitamin B3 | 0.093mg | 0.507mg | 3% |
| Vitamin B5 | 0.361mg | 0.227mg | 3% |
| Protein | 3.37g | 2.58g | 2% |
| Fiber | 0g | 0.5g | 2% |
| Copper | 0.01mg | 0.026mg | 2% |
| Zinc | 0.42mg | 0.22mg | 2% |
| Vitamin B6 | 0.037mg | 0.064mg | 2% |
| Saturated fat | 0.633g | 0.229g | 2% |
| Polyunsaturated fat | 0.035g | 0.311g | 2% |
| Starch | 2.43g | 1% | |
| Vitamin B1 | 0.02mg | 0.026mg | 1% |
| Vitamin K | 0.1µg | 1.1µg | 1% |
| Folate | 5µg | 8µg | 1% |
| Calories | 42kcal | 39kcal | 0% |
| Fats | 0.97g | 1.21g | 0% |
| Net carbs | 4.99g | 3.85g | N/A |
| Carbs | 4.99g | 4.35g | 0% |
| Magnesium | 11mg | 9mg | 0% |
| Sugar | 5.2g | 0.42g | N/A |
| Monounsaturated fat | 0.277g | 0.288g | 0% |
| Tryptophan | 0.043mg | 0.019mg | 0% |
| Threonine | 0.143mg | 0.111mg | 0% |
| Isoleucine | 0.174mg | 0.08mg | 0% |
| Leucine | 0.319mg | 0.151mg | 0% |
| Methionine | 0.088mg | 0.039mg | 0% |
| Phenylalanine | 0.174mg | 0.085mg | 0% |
| Valine | 0.22mg | 0.092mg | 0% |
| Histidine | 0.101mg | 0.058mg | 0% |
| Omega-3 - ALA | 0.004g | 0.03g | N/A |
| Omega-6 - Linoleic acid | 0.027g | 0.273g | N/A |
Macronutrient Comparison
Macronutrient breakdown side-by-side comparison
Protein:
3.37 g
Fats:
0.97 g
Carbs:
4.99 g
Water:
89.92 g
Other:
0.75 g
Protein:
2.58 g
Fats:
1.21 g
Carbs:
4.35 g
Water:
90.65 g
Other:
1.21 g
| Contains more ProteinProtein | +30.6% |
| Contains more CarbsCarbs | +14.7% |
| Contains more FatsFats | +24.7% |
| Contains more OtherOther | +61.3% |
~equal in
Water
~90.65g
Fat Type Comparison
Fat type breakdown side-by-side comparison
Saturated fat:
Sat. Fat
0.633 g
Monounsaturated fat:
Mono. Fat
0.277 g
Polyunsaturated fat:
Poly. Fat
0.035 g
Saturated fat:
Sat. Fat
0.229 g
Monounsaturated fat:
Mono. Fat
0.288 g
Polyunsaturated fat:
Poly. Fat
0.311 g
| Contains less Sat. FatSaturated fat | -63.8% |
| Contains more Poly. FatPolyunsaturated fat | +788.6% |
~equal in
Monounsaturated fat
~0.288g
Carbohydrate type comparison
Carbohydrate type breakdown side-by-side comparison
Starch:
0 g
Sucrose:
0 g
Glucose:
0 g
Fructose:
0 g
Lactose:
5.2 g
Maltose:
0 g
Galactose:
0 g
Starch:
2.43 g
Sucrose:
0.4 g
Glucose:
0.03 g
Fructose:
0 g
Lactose:
0 g
Maltose:
0 g
Galactose:
0 g
| Contains more LactoseLactose | +∞% |
| Contains more StarchStarch | +∞% |
| Contains more SucroseSucrose | +∞% |
| Contains more GlucoseGlucose | +∞% |
~equal in
Fructose
~0g
~equal in
Maltose
~0g
~equal in
Galactose
~0g


