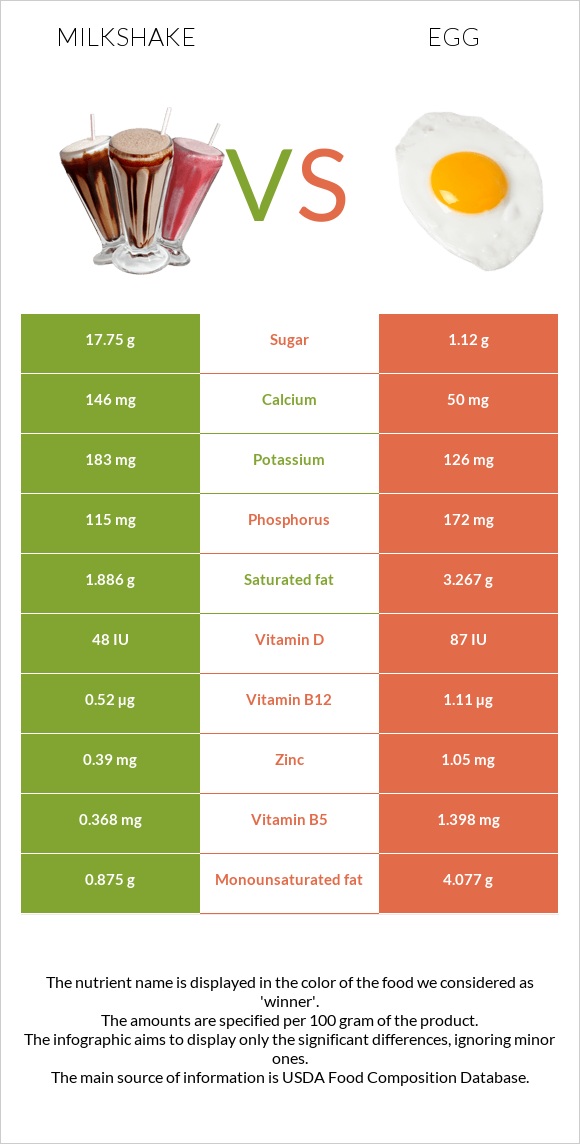
Significant differences between milkshake and eggs Milkshake has more calcium; however, eggs are richer in copper, selenium, choline, vitamin B12, vitamin B2, vitamin B5, iron, and folate. Eggs cover your daily copper needs 217% more than milkshake. Eggs have 3 times less calcium than milkshake. Milkshake has 146mg of calcium, while eggs have 50mg. Milkshake contains less cholesterol. Milkshake has a higher glycemic index. The glycemic index of milkshake is 27, while the glycemic index of eggs is 0. Specific food types used in this comparison are Milk shakes, thick vanilla and Egg, whole, cooked, hard-boiled .
Infographic
Mineral Comparison
Mineral comparison score is based on the number of minerals by which one or the other food is richer. The "coverage" charts below show how much of the daily needs can be covered by 300 grams of the food.
4
100 g
300 g
1 fl oz - 28.4g 1 container (11 oz) - 313g
Magnesium
Magnesium
Calcium
Calcium
Potassium
Potassium
Iron
Iron
Copper
Copper
Zinc
Zinc
Phosphorus
Phosphorus
Sodium
Sodium
Manganese
Manganese
Selenium
Selenium
8.6%
44%
16%
3.8%
17%
11%
49%
12%
1.8%
13%
6
100 g
300 g
1 tbsp - 8.5g 1 large - 50g 1 cup, chopped - 136g
Magnesium
Magnesium
Calcium
Calcium
Potassium
Potassium
Iron
Iron
Copper
Copper
Zinc
Zinc
Phosphorus
Phosphorus
Sodium
Sodium
Manganese
Manganese
Selenium
Selenium
7.1%
15%
11%
45%
667%
29%
74%
16%
3.4%
168%
Vitamin Comparison
Vitamin comparison score is based on the number of vitamins by which one or the other food is richer. The "coverage" charts below show how much of the daily needs can be covered by 300 grams of the food.
1
100 g
300 g
1 fl oz - 28.4g 1 container (11 oz) - 313g
Vitamin C
Vit. C
Vitamin D
Vit. D
Vitamin A
Vit. A
Vitamin E
Vit. E
Vitamin B1
Vit. B1
Vitamin B2
Vit. B2
Vitamin B3
Vit. B3
Vitamin B5
Vit. B5
Vitamin B6
Vit. B6
Vitamin B12
Vit. B12
Vitamin K
Vit. K
Folate
Folate
0%
18%
8.3%
1%
7.5%
45%
2.7%
22%
9.7%
65%
0.5%
5.3%
10
100 g
300 g
1 tbsp - 8.5g 1 large - 50g 1 cup, chopped - 136g
Vitamin C
Vit. C
Vitamin D
Vit. D
Vitamin A
Vit. A
Vitamin E
Vit. E
Vitamin B1
Vit. B1
Vitamin B2
Vit. B2
Vitamin B3
Vit. B3
Vitamin B5
Vit. B5
Vitamin B6
Vit. B6
Vitamin B12
Vit. B12
Vitamin K
Vit. K
Folate
Folate
0%
33%
50%
21%
17%
118%
1.2%
84%
28%
139%
0.75%
33%
All nutrients comparison - raw data values
Nutrient
DV% diff.
Copper
0.051mg
2mg
217%
Cholesterol
12mg
373mg
120%
Selenium
2.3µg
30.8µg
52%
Choline
14.3mg
293.8mg
51%
Vitamin B12
0.52µg
1.11µg
25%
Vitamin B2
0.195mg
0.513mg
24%
Vitamin B5
0.368mg
1.398mg
21%
Protein
3.86g
12.58g
17%
Iron
0.1mg
1.19mg
14%
Vitamin A
25µg
149µg
14%
Fats
3.03g
10.61g
12%
Calcium
146mg
50mg
10%
Folate
7µg
44µg
9%
Polyunsaturated fat
0.113g
1.414g
9%
Phosphorus
115mg
172mg
8%
Monounsaturated fat
0.875g
4.077g
8%
Vitamin E
0.05mg
1.03mg
7%
Carbs
17.75g
1.12g
6%
Zinc
0.39mg
1.05mg
6%
Vitamin B6
0.042mg
0.121mg
6%
Saturated fat
1.886g
3.267g
6%
Vitamin D*
48 IU
87 IU
5%
Vitamin D
1.2µg
2.2µg
5%
Vitamin B1
0.03mg
0.066mg
3%
Calories
112kcal
155kcal
2%
Potassium
183mg
126mg
2%
Sodium
95mg
124mg
1%
Manganese
0.014mg
0.026mg
1%
Vitamin B3
0.146mg
0.064mg
1%
Protein per 100 calories
3.4g
8.1g
N/A
Calories per 10 g protein
290kcal
123kcal
N/A
Weight per 100 calories
89g
65g
N/A
Unsaturated / Saturated Fat ratio
0.52
1.7
N/A
Net carbs
17.75g
1.12g
N/A
Magnesium
12mg
10mg
0%
Sugar
17.75g
1.12g
N/A
Vitamin K
0.2µg
0.3µg
0%
Tryptophan
0.054mg
0.153mg
0%
Threonine
0.174mg
0.604mg
0%
Isoleucine
0.234mg
0.686mg
0%
Leucine
0.378mg
1.075mg
0%
Lysine
0.306mg
0.904mg
0%
Methionine
0.097mg
0.392mg
0%
Phenylalanine
0.186mg
0.668mg
0%
Valine
0.258mg
0.767mg
0%
Histidine
0.105mg
0.298mg
0%
Omega-3 - EPA
0g
0.005g
N/A
Omega-3 - DHA
0g
0.038g
N/A
Macronutrient Comparison
Macronutrient breakdown side-by-side comparison
1
4%
3%
18%
74%
Protein:
3.86 g
Fats:
3.03 g
Carbs:
17.75 g
Water:
74.45 g
Other:
0.91 g
4
13%
11%
75%
Protein:
12.58 g
Fats:
10.61 g
Carbs:
1.12 g
Water:
74.62 g
Other:
1.07 g
Contains
more
Carbs Carbs
+1484.8%
Contains
more
Protein Protein
+225.9%
Contains
more
Fats Fats
+250.2%
Contains
more
Other Other
+17.6%
Fat Type Comparison
Fat type breakdown side-by-side comparison
1
66%
30%
4%
Saturated fat:
Sat. Fat
1.886 g
Monounsaturated fat:
Mono. Fat
0.875 g
Polyunsaturated fat:
Poly. Fat
0.113 g
2
37%
47%
16%
Saturated fat:
Sat. Fat
3.267 g
Monounsaturated fat:
Mono. Fat
4.077 g
Polyunsaturated fat:
Poly. Fat
1.414 g
Contains
less
Sat. Fat Saturated fat
-42.3%
Contains
more
Mono. Fat Monounsaturated fat
+365.9%
Contains
more
Poly. Fat Polyunsaturated fat
+1151.3%