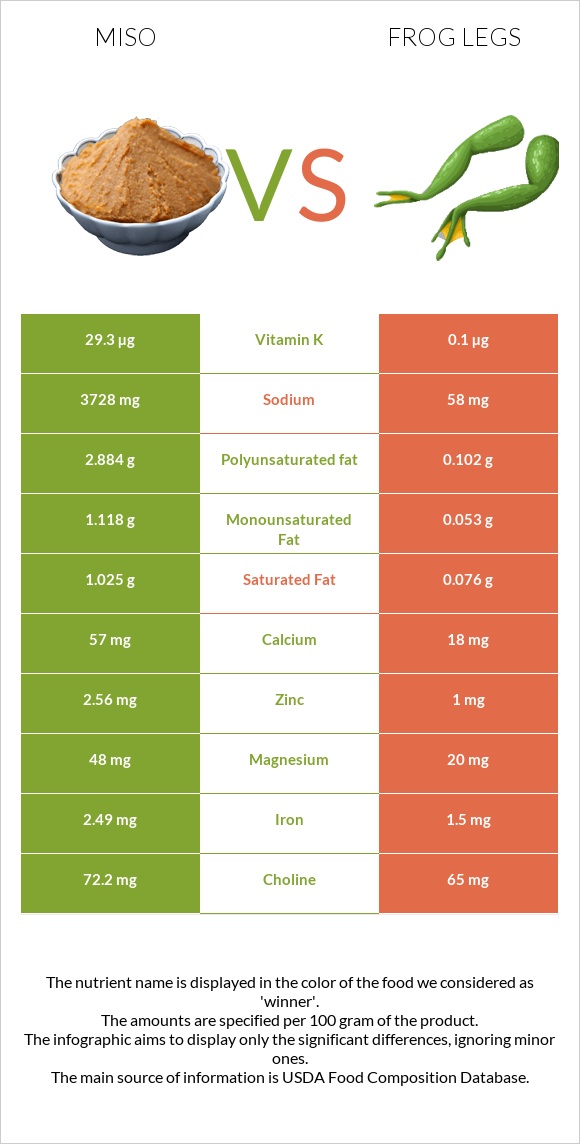
Important differences between miso and frog legs Miso has more vitamin K, fiber, copper, zinc, iron, and magnesium; however, frog legs are richer in vitamin B12 and selenium. Miso's daily need coverage for sodium is 160% more. Frog legs contain less sodium. Miso has a higher glycemic index. The glycemic index of miso is 61, while the glycemic index of frog legs is 0. The food varieties used in the comparison are Miso and Frog legs, raw .
Infographic
Mineral Comparison
Mineral comparison score is based on the number of minerals by which one or the other food is richer. The "coverage" charts below show how much of the daily needs can be covered by 300 grams of the food.
6
100 g
300 g
1 tbsp - 17g 1 cup - 275g
Magnesium
Magnesium
Calcium
Calcium
Potassium
Potassium
Iron
Iron
Copper
Copper
Zinc
Zinc
Phosphorus
Phosphorus
Sodium
Sodium
Manganese
Manganese
Selenium
Selenium
34%
17%
19%
93%
140%
70%
68%
486%
112%
38%
3
100 g
300 g
1 leg - 45g
Magnesium
Magnesium
Calcium
Calcium
Potassium
Potassium
Iron
Iron
Copper
Copper
Zinc
Zinc
Phosphorus
Phosphorus
Sodium
Sodium
Manganese
Manganese
Selenium
Selenium
14%
5.4%
25%
56%
83%
27%
63%
7.6%
0%
77%
Vitamin Comparison
Vitamin comparison score is based on the number of vitamins by which one or the other food is richer. The "coverage" charts below show how much of the daily needs can be covered by 300 grams of the food.
4
100 g
300 g
1 tbsp - 17g 1 cup - 275g
Vitamin C
Vit. C
Vitamin D
Vit. D
Vitamin A
Vit. A
Vitamin E
Vit. E
Vitamin B1
Vit. B1
Vitamin B2
Vit. B2
Vitamin B3
Vit. B3
Vitamin B5
Vit. B5
Vitamin B6
Vit. B6
Vitamin B12
Vit. B12
Vitamin K
Vit. K
Folate
Folate
0%
0%
1.3%
0.2%
25%
54%
17%
20%
46%
10%
73%
14%
6
100 g
300 g
1 leg - 45g
Vitamin C
Vit. C
Vitamin D
Vit. D
Vitamin A
Vit. A
Vitamin E
Vit. E
Vitamin B1
Vit. B1
Vitamin B2
Vit. B2
Vitamin B3
Vit. B3
Vitamin B5
Vit. B5
Vitamin B6
Vit. B6
Vitamin B12
Vit. B12
Vitamin K
Vit. K
Folate
Folate
0%
3%
5%
20%
35%
58%
23%
0%
28%
50%
0.25%
11%
All nutrients comparison - raw data values
Nutrient
DV% diff.
Sodium
3728mg
58mg
160%
Manganese
0.859mg
37%
Vitamin K
29.3µg
0.1µg
24%
Fiber
5.4g
0g
22%
Copper
0.42mg
0.25mg
19%
Polyunsaturated fat
2.884g
0.102g
19%
Cholesterol
0mg
50mg
17%
Zinc
2.56mg
1mg
14%
Selenium
7µg
14.1µg
13%
Vitamin B12
0.08µg
0.4µg
13%
Iron
2.49mg
1.5mg
12%
Fats
6.01g
0.3g
9%
Carbs
25.37g
0g
8%
Fructose
6g
8%
Protein
12.79g
16.4g
7%
Magnesium
48mg
20mg
7%
Vitamin E
0.01mg
1mg
7%
Vitamin B5
0.337mg
7%
Calories
198kcal
73kcal
6%
Vitamin B6
0.199mg
0.12mg
6%
Calcium
57mg
18mg
4%
Vitamin B1
0.098mg
0.14mg
4%
Saturated fat
1.025g
0.076g
4%
Monounsaturated fat
1.118g
0.053g
3%
Potassium
210mg
285mg
2%
Phosphorus
159mg
147mg
2%
Vitamin B3
0.906mg
1.2mg
2%
Vitamin D*
0 IU
8 IU
1%
Vitamin D
0µg
0.2µg
1%
Vitamin A
4µg
15µg
1%
Vitamin B2
0.233mg
0.25mg
1%
Folate
19µg
15µg
1%
Choline
72.2mg
65mg
1%
Protein per 100 calories
6.5g
22g
N/A
Calories per 10 g protein
155kcal
45kcal
N/A
Weight per 100 calories
51g
137g
N/A
Unsaturated / Saturated Fat ratio
3.9
2
N/A
Net carbs
19.97g
0g
N/A
Sugar
6.2g
0g
N/A
Tryptophan
0.155mg
0%
Threonine
0.479mg
0%
Isoleucine
0.508mg
0%
Leucine
0.82mg
0%
Lysine
0.478mg
0%
Methionine
0.129mg
0%
Phenylalanine
0.486mg
0%
Valine
0.547mg
0%
Histidine
0.243mg
0%
Omega-3 - EPA
0g
0.014g
N/A
Omega-3 - DHA
0g
0.02g
N/A
Omega-3 - DPA
0g
0.007g
N/A
Macronutrient Comparison
Macronutrient breakdown side-by-side comparison
3
13%
6%
25%
43%
13%
Protein:
12.79 g
Fats:
6.01 g
Carbs:
25.37 g
Water:
43.02 g
Other:
12.81 g
2
16%
82%
Protein:
16.4 g
Fats:
0.3 g
Carbs:
0 g
Water:
81.9 g
Other:
1.4 g
Contains
more
Fats Fats
+1903.3%
Contains
more
Carbs Carbs
+∞%
Contains
more
Other Other
+815%
Contains
more
Protein Protein
+28.2%
Contains
more
Water Water
+90.4%
Fat Type Comparison
Fat type breakdown side-by-side comparison
2
20%
22%
57%
Saturated fat:
Sat. Fat
1.025 g
Monounsaturated fat:
Mono. Fat
1.118 g
Polyunsaturated fat:
Poly. Fat
2.884 g
1
33%
23%
44%
Saturated fat:
Sat. Fat
0.076 g
Monounsaturated fat:
Mono. Fat
0.053 g
Polyunsaturated fat:
Poly. Fat
0.102 g
Contains
more
Mono. Fat Monounsaturated fat
+2009.4%
Contains
more
Poly. Fat Polyunsaturated fat
+2727.5%
Contains
less
Sat. Fat Saturated fat
-92.6%