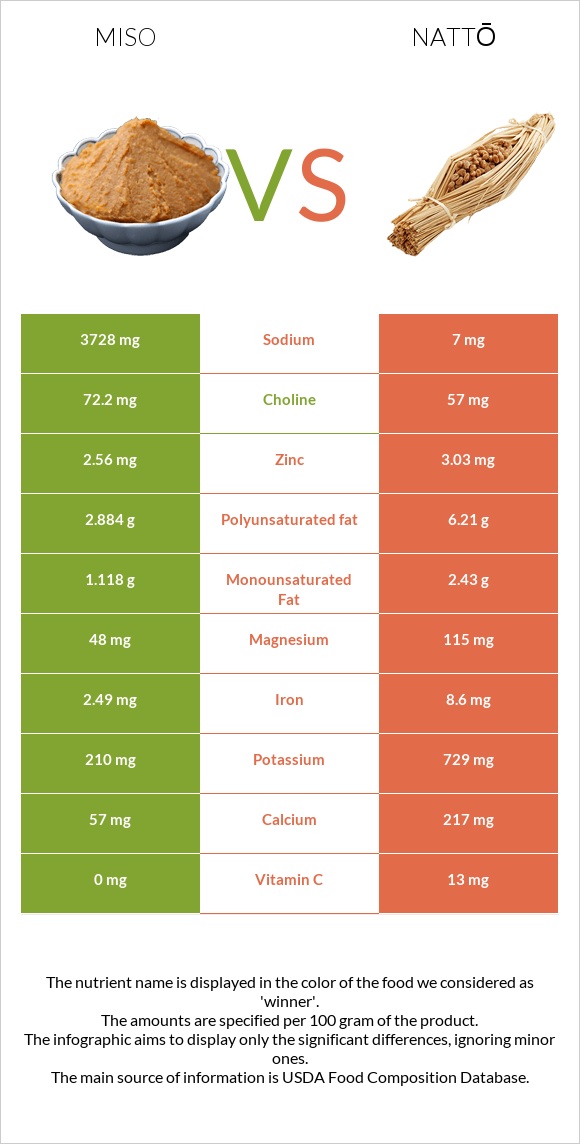
A recap on the differences between miso and nattō Miso has more vitamin B3 and vitamin B6; however, nattō is higher in iron, manganese, copper, calcium, magnesium, potassium, and vitamin C. Miso covers your daily sodium needs 162% more than nattō. Nattō has less sodium. Food varieties used in this article are Miso and Natto .
Infographic
Mineral Comparison
Mineral comparison score is based on the number of minerals by which one or the other food is richer. The "coverage" charts below show how much of the daily needs can be covered by 300 grams of the food.
0
100 g
300 g
1 tbsp - 17g 1 cup - 275g
Magnesium
Magnesium
Calcium
Calcium
Potassium
Potassium
Iron
Iron
Copper
Copper
Zinc
Zinc
Phosphorus
Phosphorus
Sodium
Sodium
Manganese
Manganese
Selenium
Selenium
34%
17%
19%
93%
140%
70%
68%
486%
112%
38%
9
100 g
300 g
1 cup - 175g
Magnesium
Magnesium
Calcium
Calcium
Potassium
Potassium
Iron
Iron
Copper
Copper
Zinc
Zinc
Phosphorus
Phosphorus
Sodium
Sodium
Manganese
Manganese
Selenium
Selenium
82%
65%
64%
323%
222%
83%
75%
0.91%
199%
48%
Vitamin Comparison
Vitamin comparison score is based on the number of vitamins by which one or the other food is richer. The "coverage" charts below show how much of the daily needs can be covered by 300 grams of the food.
8
100 g
300 g
1 tbsp - 17g 1 cup - 275g
Vitamin C
Vit. C
Vitamin D
Vit. D
Vitamin A
Vit. A
Vitamin E
Vit. E
Vitamin B1
Vit. B1
Vitamin B2
Vit. B2
Vitamin B3
Vit. B3
Vitamin B5
Vit. B5
Vitamin B6
Vit. B6
Vitamin B12
Vit. B12
Vitamin K
Vit. K
Folate
Folate
0%
0%
1.3%
0.2%
25%
54%
17%
20%
46%
10%
73%
14%
2
100 g
300 g
1 cup - 175g
Vitamin C
Vit. C
Vitamin D
Vit. D
Vitamin A
Vit. A
Vitamin E
Vit. E
Vitamin B1
Vit. B1
Vitamin B2
Vit. B2
Vitamin B3
Vit. B3
Vitamin B5
Vit. B5
Vitamin B6
Vit. B6
Vitamin B12
Vit. B12
Vitamin K
Vit. K
Folate
Folate
43%
0%
0%
0.2%
40%
44%
0%
13%
30%
0%
58%
6%
All nutrients comparison - raw data values
Nutrient
DV% diff.
Sodium
3728mg
7mg
162%
Iron
2.49mg
8.6mg
76%
Manganese
0.859mg
1.528mg
29%
Copper
0.42mg
0.667mg
27%
Polyunsaturated fat
2.884g
6.21g
22%
Magnesium
48mg
115mg
16%
Calcium
57mg
217mg
16%
Potassium
210mg
729mg
15%
Vitamin C
0mg
13mg
14%
Protein
12.79g
19.4g
13%
Fats
6.01g
11g
8%
Fructose
6g
8%
Vitamin B3
0.906mg
0mg
6%
Vitamin B1
0.098mg
0.16mg
5%
Vitamin B6
0.199mg
0.13mg
5%
Vitamin K
29.3µg
23.1µg
5%
Carbs
25.37g
12.68g
4%
Zinc
2.56mg
3.03mg
4%
Selenium
7µg
8.8µg
3%
Vitamin B2
0.233mg
0.19mg
3%
Vitamin B12
0.08µg
0µg
3%
Folate
19µg
8µg
3%
Choline
72.2mg
57mg
3%
Saturated fat
1.025g
1.591g
3%
Monounsaturated fat
1.118g
2.43g
3%
Phosphorus
159mg
174mg
2%
Vitamin B5
0.337mg
0.215mg
2%
Calories
198kcal
211kcal
1%
Protein per 100 calories
6.5g
9.2g
N/A
Calories per 10 g protein
155kcal
109kcal
N/A
Weight per 100 calories
51g
47g
N/A
Unsaturated / Saturated Fat ratio
3.9
5.4
N/A
Net carbs
19.97g
7.28g
N/A
Sugar
6.2g
4.89g
N/A
Fiber
5.4g
5.4g
0%
Vitamin A
4µg
0µg
0%
Vitamin E
0.01mg
0.01mg
0%
Tryptophan
0.155mg
0.223mg
0%
Threonine
0.479mg
0.813mg
0%
Isoleucine
0.508mg
0.931mg
0%
Leucine
0.82mg
1.509mg
0%
Lysine
0.478mg
1.145mg
0%
Methionine
0.129mg
0.208mg
0%
Phenylalanine
0.486mg
0.941mg
0%
Valine
0.547mg
1.018mg
0%
Histidine
0.243mg
0.512mg
0%
Macronutrient Comparison
Macronutrient breakdown side-by-side comparison
2
13%
6%
25%
43%
13%
Protein:
12.79 g
Fats:
6.01 g
Carbs:
25.37 g
Water:
43.02 g
Other:
12.81 g
3
19%
11%
13%
55%
2%
Protein:
19.4 g
Fats:
11 g
Carbs:
12.68 g
Water:
55.02 g
Other:
1.9 g
Contains
more
Carbs Carbs
+100.1%
Contains
more
Other Other
+574.2%
Contains
more
Protein Protein
+51.7%
Contains
more
Fats Fats
+83%
Contains
more
Water Water
+27.9%
Fat Type Comparison
Fat type breakdown side-by-side comparison
1
20%
22%
57%
Saturated fat:
Sat. Fat
1.025 g
Monounsaturated fat:
Mono. Fat
1.118 g
Polyunsaturated fat:
Poly. Fat
2.884 g
2
16%
24%
61%
Saturated fat:
Sat. Fat
1.591 g
Monounsaturated fat:
Mono. Fat
2.43 g
Polyunsaturated fat:
Poly. Fat
6.21 g
Contains
less
Sat. Fat Saturated fat
-35.6%
Contains
more
Mono. Fat Monounsaturated fat
+117.4%
Contains
more
Poly. Fat Polyunsaturated fat
+115.3%