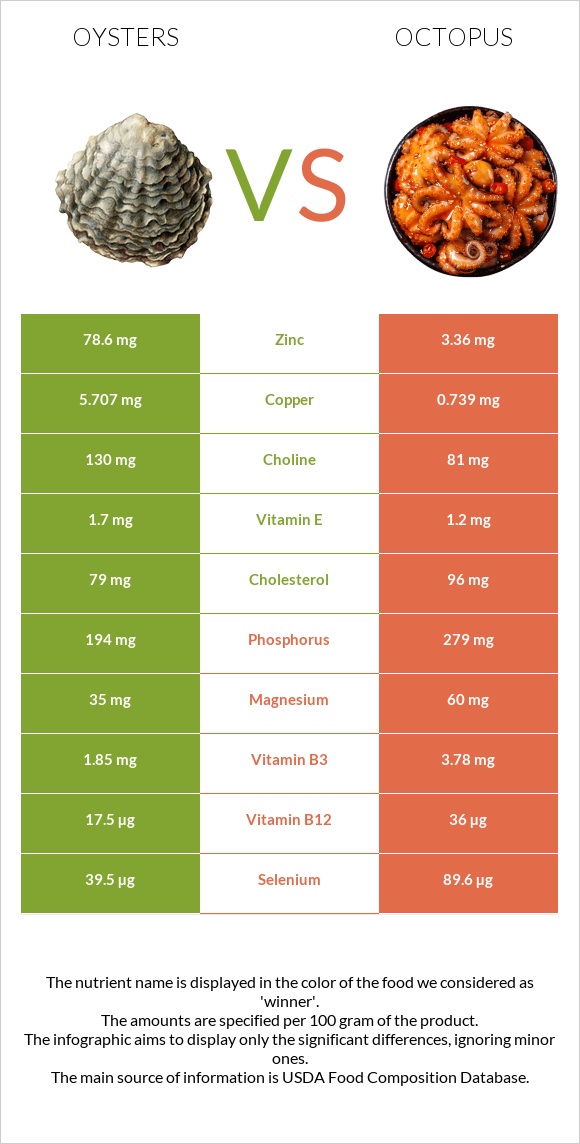
How are oysters and octopus different? Oysters is higher in zinc, copper, and manganese; however, octopus is richer in vitamin B12, selenium, vitamin B6, potassium, phosphorus, and vitamin B3. Daily need coverage for vitamin B12 for octopus is 771% higher. Oysters contains 23 times more zinc than octopus. While oysters contains 78.6mg of zinc, octopus contains only 3.36mg. Oysters has less sodium. Mollusks, oyster, eastern, wild, cooked, moist heat and Mollusks, octopus, common, cooked, moist heat are the varieties used in this article.
Infographic
Mineral Comparison
Mineral comparison score is based on the number of minerals by which one or the other food is richer. The "coverage" charts below show how much of the daily needs can be covered by 300 grams of the food.
4
100 g
300 g
6 medium - 42g 3 oz - 85g
Magnesium
Magnesium
Calcium
Calcium
Potassium
Potassium
Iron
Iron
Copper
Copper
Zinc
Zinc
Phosphorus
Phosphorus
Sodium
Sodium
Manganese
Manganese
Selenium
Selenium
25%
35%
12%
345%
1902%
2144%
83%
22%
77%
215%
4
100 g
300 g
3 oz - 85g
Magnesium
Magnesium
Calcium
Calcium
Potassium
Potassium
Iron
Iron
Copper
Copper
Zinc
Zinc
Phosphorus
Phosphorus
Sodium
Sodium
Manganese
Manganese
Selenium
Selenium
43%
32%
56%
358%
246%
92%
120%
60%
6.1%
489%
Vitamin Comparison
Vitamin comparison score is based on the number of vitamins by which one or the other food is richer. The "coverage" charts below show how much of the daily needs can be covered by 300 grams of the food.
3
100 g
300 g
6 medium - 42g 3 oz - 85g
Vitamin C
Vit. C
Vitamin D
Vit. D
Vitamin A
Vit. A
Vitamin E
Vit. E
Vitamin B1
Vit. B1
Vitamin B2
Vit. B2
Vitamin B3
Vit. B3
Vitamin B5
Vit. B5
Vitamin B6
Vit. B6
Vitamin B12
Vit. B12
Vitamin K
Vit. K
Folate
Folate
0%
0%
8.7%
34%
9%
42%
35%
27%
14%
2188%
5%
11%
8
100 g
300 g
3 oz - 85g
Vitamin C
Vit. C
Vitamin D
Vit. D
Vitamin A
Vit. A
Vitamin E
Vit. E
Vitamin B1
Vit. B1
Vitamin B2
Vit. B2
Vitamin B3
Vit. B3
Vitamin B5
Vit. B5
Vitamin B6
Vit. B6
Vitamin B12
Vit. B12
Vitamin K
Vit. K
Folate
Folate
27%
0%
30%
24%
14%
18%
71%
54%
150%
4500%
0.25%
18%
All nutrients comparison - raw data values
Nutrient
DV% diff.
Vitamin B12
17.5µg
36µg
771%
Zinc
78.6mg
3.36mg
684%
Copper
5.707mg
0.739mg
552%
Selenium
39.5µg
89.6µg
91%
Vitamin B6
0.061mg
0.648mg
45%
Protein
11.42g
29.82g
37%
Manganese
0.591mg
0.047mg
24%
Potassium
139mg
630mg
14%
Sodium
166mg
460mg
13%
Phosphorus
194mg
279mg
12%
Vitamin B3
1.85mg
3.78mg
12%
Vitamin C
0mg
8mg
9%
Vitamin B5
0.447mg
0.9mg
9%
Choline
130mg
81mg
9%
Vitamin B2
0.18mg
0.076mg
8%
Vitamin A
26µg
90µg
7%
Cholesterol
79mg
96mg
6%
Magnesium
35mg
60mg
6%
Iron
9.21mg
9.54mg
4%
Polyunsaturated fat
1.056g
0.477g
4%
Calories
102kcal
164kcal
3%
Vitamin E
1.7mg
1.2mg
3%
Folate
14µg
24µg
3%
Fats
3.42g
2.08g
2%
Vitamin B1
0.036mg
0.057mg
2%
Vitamin K
2µg
0.1µg
2%
Saturated fat
0.948g
0.453g
2%
Calcium
116mg
106mg
1%
Protein per 100 calories
11g
18g
N/A
Calories per 10 g protein
89kcal
55kcal
N/A
Weight per 100 calories
98g
61g
N/A
Unsaturated / Saturated Fat ratio
1.6
1.8
N/A
Net carbs
5.45g
4.4g
N/A
Carbs
5.45g
4.4g
0%
Vitamin D*
2 IU
0 IU
0%
Sugar
1.23g
0g
N/A
Starch
0.9g
0%
Trans fat
0.068g
N/A
Monounsaturated fat
0.506g
0.324g
0%
Tryptophan
0.138mg
0.334mg
0%
Threonine
0.046mg
1.283mg
0%
Isoleucine
0.459mg
1.298mg
0%
Leucine
0.716mg
2.099mg
0%
Lysine
0.762mg
2.228mg
0%
Methionine
0.257mg
0.673mg
0%
Phenylalanine
0.413mg
1.069mg
0%
Valine
0.523mg
1.303mg
0%
Histidine
0.22mg
0.573mg
0%
Omega-3 - EPA
0.353g
0.152g
N/A
Omega-3 - DHA
0.271g
0.162g
N/A
Omega-3 - ALA
0.163g
N/A
Omega-3 - DPA
0.02g
0.012g
N/A
Omega-3 - Eicosatrienoic acid
0.004g
N/A
Omega-6 - Gamma-linoleic acid
0.004g
N/A
Omega-6 - Dihomo-gamma-linoleic acid
0.007g
N/A
Omega-6 - Eicosadienoic acid
0.007g
N/A
Omega-6 - Linoleic acid
0.061g
N/A
Macronutrient Comparison
Macronutrient breakdown side-by-side comparison
3
11%
3%
5%
78%
Protein:
11.42 g
Fats:
3.42 g
Carbs:
5.45 g
Water:
78.19 g
Other:
1.52 g
2
30%
2%
4%
61%
3%
Protein:
29.82 g
Fats:
2.08 g
Carbs:
4.4 g
Water:
60.5 g
Other:
3.2 g
Contains
more
Fats Fats
+64.4%
Contains
more
Carbs Carbs
+23.9%
Contains
more
Water Water
+29.2%
Contains
more
Protein Protein
+161.1%
Contains
more
Other Other
+110.5%
Fat Type Comparison
Fat type breakdown side-by-side comparison
2
38%
20%
42%
Saturated fat:
Sat. Fat
0.948 g
Monounsaturated fat:
Mono. Fat
0.506 g
Polyunsaturated fat:
Poly. Fat
1.056 g
1
36%
26%
38%
Saturated fat:
Sat. Fat
0.453 g
Monounsaturated fat:
Mono. Fat
0.324 g
Polyunsaturated fat:
Poly. Fat
0.477 g
Contains
more
Mono. Fat Monounsaturated fat
+56.2%
Contains
more
Poly. Fat Polyunsaturated fat
+121.4%
Contains
less
Sat. Fat Saturated fat
-52.2%