Monterey Jack vs. Muenster cheese — In-Depth Nutrition Comparison
Compare
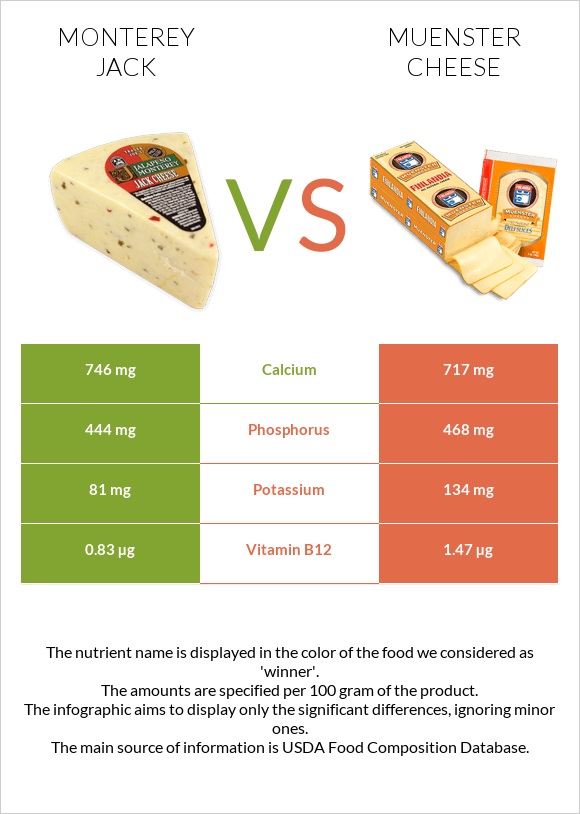
A recap on the differences between monterey Jack and muenster cheese
- Monterey Jack has more vitamin B2; however, muenster cheese is higher in vitamin B12.
- Muenster cheese covers your daily vitamin B12 needs 27% more than monterey Jack.
Food varieties used in this article are Cheese, monterey and Cheese, muenster.
Infographic
Infographic link
Mineral Comparison
Mineral comparison score is based on the number of minerals by which one or the other food is richer. The "coverage" charts below show how much of the daily needs can be covered by 300 grams of the food.
| Contains more IronIron | +75.6% |
| Contains more ManganeseManganese | +37.5% |
| Contains more PotassiumPotassium | +65.4% |
Vitamin Comparison
Vitamin comparison score is based on the number of vitamins by which one or the other food is richer. The "coverage" charts below show how much of the daily needs can be covered by 300 grams of the food.
| Contains more Vitamin B1Vitamin B1 | +15.4% |
| Contains more Vitamin B2Vitamin B2 | +21.9% |
| Contains more Vitamin B6Vitamin B6 | +41.1% |
| Contains more FolateFolate | +50% |
| Contains more Vitamin AVitamin A | +50.5% |
| Contains more Vitamin B3Vitamin B3 | +10.8% |
| Contains more Vitamin B12Vitamin B12 | +77.1% |
All nutrients comparison - raw data values
| Nutrient |  |
 |
DV% diff. |
| Vitamin B12 | 0.83µg | 1.47µg | 27% |
| Vitamin A | 198µg | 298µg | 11% |
| Vitamin B2 | 0.39mg | 0.32mg | 5% |
| Iron | 0.72mg | 0.41mg | 4% |
| Calcium | 746mg | 717mg | 3% |
| Phosphorus | 444mg | 468mg | 3% |
| Protein | 24.48g | 23.41g | 2% |
| Cholesterol | 89mg | 96mg | 2% |
| Potassium | 81mg | 134mg | 2% |
| Zinc | 3mg | 2.81mg | 2% |
| Vitamin B6 | 0.079mg | 0.056mg | 2% |
| Folate | 18µg | 12µg | 2% |
| Polyunsaturated fat | 0.899g | 0.661g | 2% |
| Sodium | 600mg | 628mg | 1% |
| Calories | 373kcal | 368kcal | 0% |
| Protein per 100 calories | 6.6g | 6.4g | N/A |
| Calories per 10 g protein | 152kcal | 157kcal | N/A |
| Weight per 100 calories | 27g | 27g | N/A |
| Fats | 30.28g | 30.04g | 0% |
| Unsaturated / Saturated Fat ratio | 0.51 | 0.49 | N/A |
| Net carbs | 0.68g | 1.12g | N/A |
| Carbs | 0.68g | 1.12g | 0% |
| Vitamin D* | 22 IU | 22 IU | 0% |
| Vitamin D | 0.6µg | 0.6µg | 0% |
| Magnesium | 27mg | 27mg | 0% |
| Sugar | 0.5g | 1.12g | N/A |
| Copper | 0.032mg | 0.031mg | 0% |
| Vitamin E | 0.26mg | 0.26mg | 0% |
| Manganese | 0.011mg | 0.008mg | 0% |
| Selenium | 14.5µg | 14.5µg | 0% |
| Vitamin B1 | 0.015mg | 0.013mg | 0% |
| Vitamin B3 | 0.093mg | 0.103mg | 0% |
| Vitamin B5 | 0.21mg | 0.19mg | 0% |
| Vitamin K | 2.5µg | 2.5µg | 0% |
| Choline | 15.4mg | 15.4mg | 0% |
| Saturated fat | 19.066g | 19.113g | 0% |
| Monounsaturated fat | 8.751g | 8.711g | 0% |
| Tryptophan | 0.315mg | 0.327mg | 0% |
| Threonine | 0.871mg | 0.888mg | 0% |
| Isoleucine | 1.519mg | 1.145mg | 0% |
| Leucine | 2.344mg | 2.26mg | 0% |
| Lysine | 2.037mg | 2.139mg | 0% |
| Methionine | 0.641mg | 0.569mg | 0% |
| Phenylalanine | 1.289mg | 1.24mg | 0% |
| Valine | 1.635mg | 1.482mg | 0% |
| Histidine | 0.859mg | 0.829mg | 0% |
Macronutrient Comparison
Macronutrient breakdown side-by-side comparison
Protein:
24.48 g
Fats:
30.28 g
Carbs:
0.68 g
Water:
41.01 g
Other:
3.55 g
Protein:
23.41 g
Fats:
30.04 g
Carbs:
1.12 g
Water:
41.77 g
Other:
3.66 g
| Contains more CarbsCarbs | +64.7% |
~equal in
Protein
~23.41g
~equal in
Fats
~30.04g
~equal in
Water
~41.77g
~equal in
Other
~3.66g
Fat Type Comparison
Fat type breakdown side-by-side comparison
Saturated fat:
Sat. Fat
19.066 g
Monounsaturated fat:
Mono. Fat
8.751 g
Polyunsaturated fat:
Poly. Fat
0.899 g
Saturated fat:
Sat. Fat
19.113 g
Monounsaturated fat:
Mono. Fat
8.711 g
Polyunsaturated fat:
Poly. Fat
0.661 g
| Contains more Poly. FatPolyunsaturated fat | +36% |
~equal in
Saturated fat
~19.113g
~equal in
Monounsaturated fat
~8.711g


