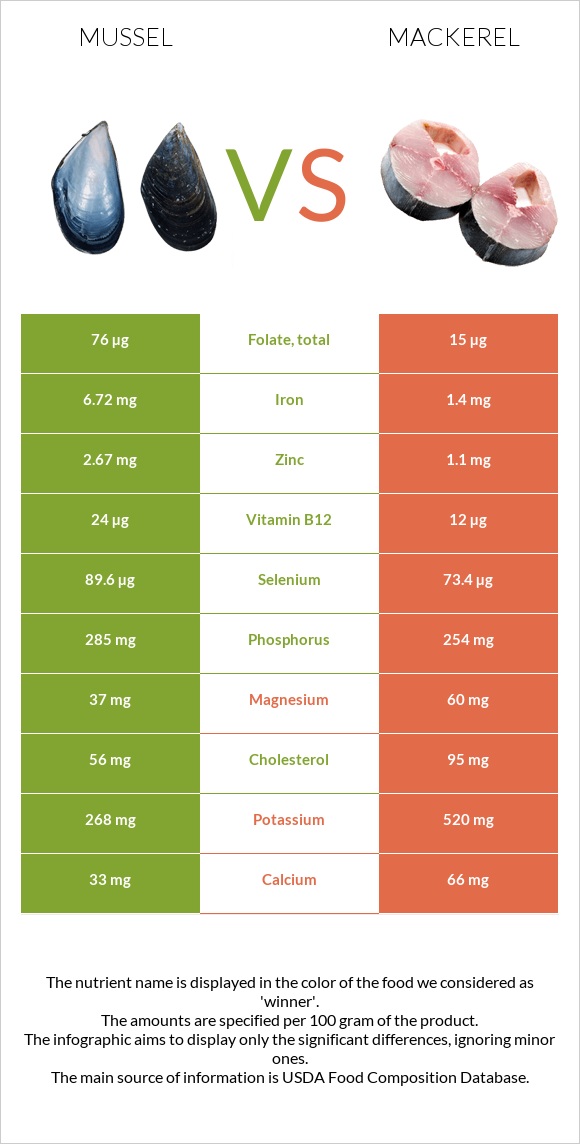
Important differences between mussels and mackerel Mussels has more manganese, vitamin B12, selenium, iron, folate, zinc, and vitamin C; however, mackerel has more vitamin B6 and vitamin B3. Mussels's daily need coverage for manganese is 295% more. Mussels has 38 times more folate than mackerel. Mussels has 76µg of folate, while mackerel has 2µg. Mussels is lower in saturated fat. Mussels has a higher glycemic index than mackerel. The food varieties used in the comparison are Mollusks, mussel, blue, cooked, moist heat and Fish, mackerel, Atlantic, cooked, dry heat .
Infographic
Mineral Comparison
Mineral comparison score is based on the number of minerals by which one or the other food is richer. The "coverage" charts below show how much of the daily needs can be covered by 300 grams of the food.
6
100 g
300 g
3 oz - 85g
Magnesium
Magnesium
Calcium
Calcium
Potassium
Potassium
Iron
Iron
Copper
Copper
Zinc
Zinc
Phosphorus
Phosphorus
Sodium
Sodium
Manganese
Manganese
Selenium
Selenium
26%
9.9%
24%
252%
50%
73%
122%
48%
887%
489%
3
100 g
300 g
3 oz - 85g 1 fillet - 88g
Magnesium
Magnesium
Calcium
Calcium
Potassium
Potassium
Iron
Iron
Copper
Copper
Zinc
Zinc
Phosphorus
Phosphorus
Sodium
Sodium
Manganese
Manganese
Selenium
Selenium
69%
4.5%
35%
59%
31%
26%
119%
11%
2.6%
281%
Vitamin Comparison
Vitamin comparison score is based on the number of vitamins by which one or the other food is richer. The "coverage" charts below show how much of the daily needs can be covered by 300 grams of the food.
5
100 g
300 g
3 oz - 85g
Vitamin C
Vit. C
Vitamin D
Vit. D
Vitamin A
Vit. A
Vitamin E
Vit. E
Vitamin B1
Vit. B1
Vitamin B2
Vit. B2
Vitamin B3
Vit. B3
Vitamin B5
Vit. B5
Vitamin B6
Vit. B6
Vitamin B12
Vit. B12
Vitamin K
Vit. K
Folate
Folate
45%
0%
30%
0%
75%
97%
56%
57%
23%
3000%
0%
57%
2
100 g
300 g
3 oz - 85g 1 fillet - 88g
Vitamin C
Vit. C
Vitamin D
Vit. D
Vitamin A
Vit. A
Vitamin E
Vit. E
Vitamin B1
Vit. B1
Vitamin B2
Vit. B2
Vitamin B3
Vit. B3
Vitamin B5
Vit. B5
Vitamin B6
Vit. B6
Vitamin B12
Vit. B12
Vitamin K
Vit. K
Folate
Folate
1.3%
0%
18%
0%
40%
95%
128%
59%
106%
2375%
0%
1.5%
All nutrients comparison - raw data values
Nutrient
DV% diff.
Manganese
6.8mg
0.02mg
295%
Vitamin B12
24µg
19µg
208%
Selenium
89.6µg
51.6µg
69%
Iron
6.72mg
1.57mg
64%
Vitamin B6
0.1mg
0.46mg
28%
Vitamin B3
3mg
6.85mg
24%
Fats
4.48g
17.81g
21%
Polyunsaturated fat
1.212g
4.3g
21%
Folate
76µg
2µg
19%
Zinc
2.67mg
0.94mg
16%
Vitamin C
13.6mg
0.4mg
15%
Saturated fat
0.85g
4.176g
15%
Monounsaturated fat
1.014g
7.006g
15%
Magnesium
37mg
97mg
14%
Sodium
369mg
83mg
12%
Vitamin B1
0.3mg
0.159mg
12%
Cholesterol
56mg
75mg
6%
Copper
0.149mg
0.094mg
6%
Calories
172kcal
262kcal
5%
Potassium
268mg
401mg
4%
Vitamin A
91µg
54µg
4%
Carbs
7.39g
0g
2%
Calcium
33mg
15mg
2%
Phosphorus
285mg
278mg
1%
Vitamin B2
0.42mg
0.412mg
1%
Vitamin B5
0.95mg
0.99mg
1%
Protein
23.8g
23.85g
0%
Protein per 100 calories
14g
9.1g
N/A
Calories per 10 g protein
72kcal
110kcal
N/A
Weight per 100 calories
58g
38g
N/A
Unsaturated / Saturated Fat ratio
2.6
2.7
N/A
Net carbs
7.39g
0g
N/A
Tryptophan
0.267mg
0.267mg
0%
Threonine
1.025mg
1.045mg
0%
Isoleucine
1.036mg
1.099mg
0%
Leucine
1.676mg
1.938mg
0%
Lysine
1.779mg
2.19mg
0%
Methionine
0.537mg
0.706mg
0%
Phenylalanine
0.853mg
0.931mg
0%
Valine
1.04mg
1.228mg
0%
Histidine
0.457mg
0.702mg
0%
Omega-3 - EPA
0.276g
0.504g
N/A
Omega-3 - DHA
0.506g
0.699g
N/A
Omega-3 - DPA
0.044g
0.106g
N/A
Macronutrient Comparison
Macronutrient breakdown side-by-side comparison
2
24%
4%
7%
61%
3%
Protein:
23.8 g
Fats:
4.48 g
Carbs:
7.39 g
Water:
61.15 g
Other:
3.18 g
3
24%
18%
53%
5%
Protein:
23.85 g
Fats:
17.81 g
Carbs:
0 g
Water:
53.27 g
Other:
5.07 g
Contains
more
Carbs Carbs
+∞%
Contains
more
Water Water
+14.8%
Contains
more
Fats Fats
+297.5%
Contains
more
Other Other
+59.4%
~equal in
Protein
~23.85g
Fat Type Comparison
Fat type breakdown side-by-side comparison
1
28%
33%
39%
Saturated fat:
Sat. Fat
0.85 g
Monounsaturated fat:
Mono. Fat
1.014 g
Polyunsaturated fat:
Poly. Fat
1.212 g
2
27%
45%
28%
Saturated fat:
Sat. Fat
4.176 g
Monounsaturated fat:
Mono. Fat
7.006 g
Polyunsaturated fat:
Poly. Fat
4.3 g
Contains
less
Sat. Fat Saturated fat
-79.6%
Contains
more
Mono. Fat Monounsaturated fat
+590.9%
Contains
more
Poly. Fat Polyunsaturated fat
+254.8%