Mussels nutrition: calories, carbs, GI, protein, fiber, fats
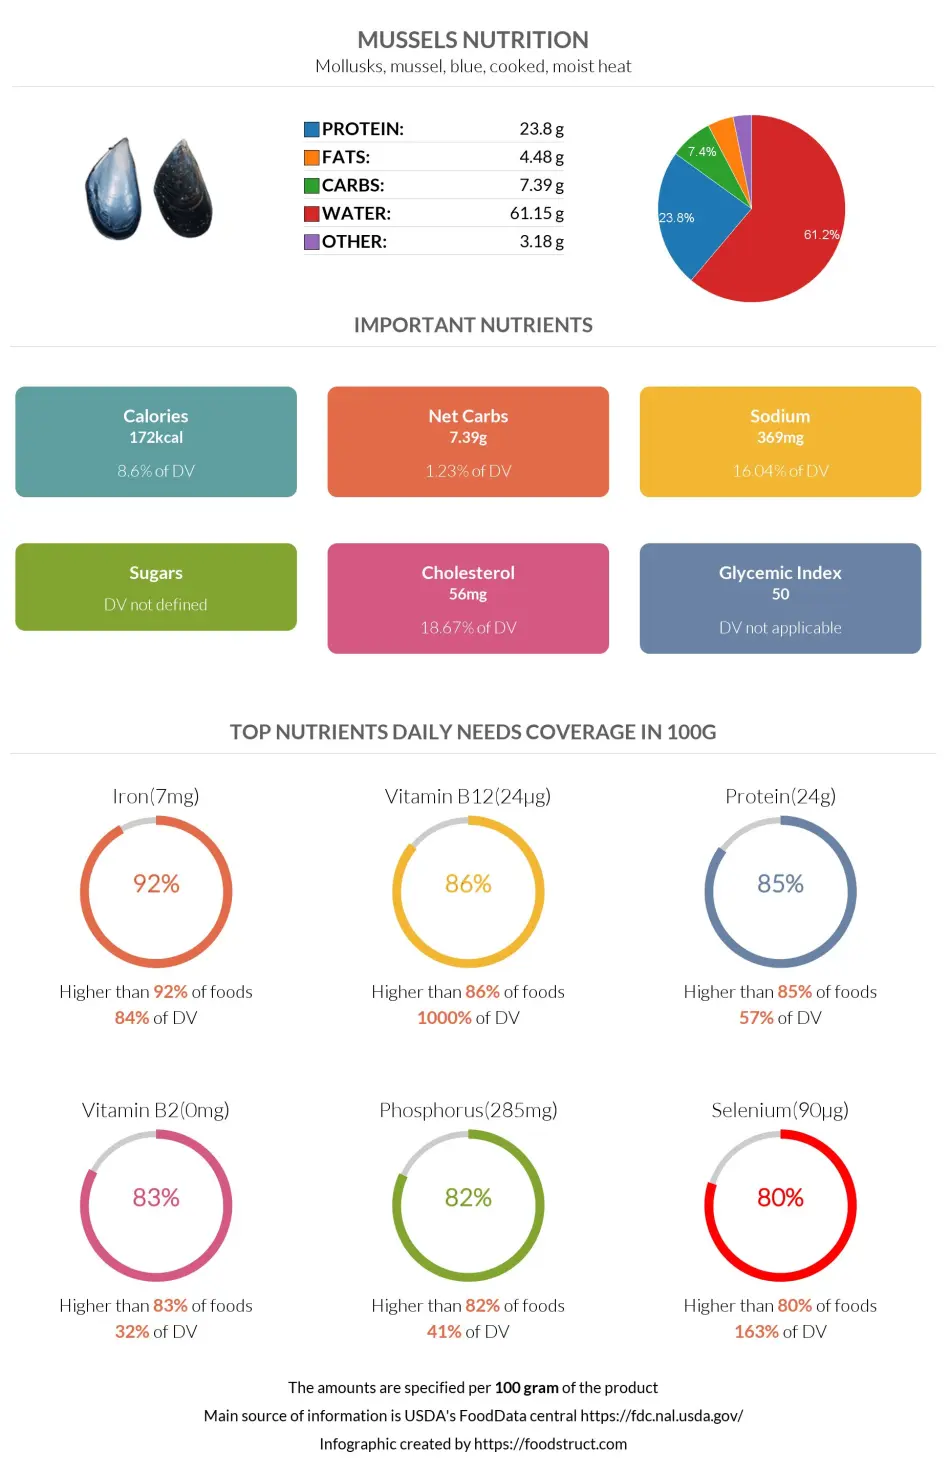
Mollusks, mussel, blue, cooked, moist heat
*all the values are displayed for the amount of 100 grams
Top nutrition facts for Mussels

| Calories ⓘ Calories for selected serving | 172 kcal |
| Glycemic index ⓘ Gi values are taken from various scientific sources. GI values less than 55 are considered as low. Values above 70 are considered as high. | 50 (low) |
| Glycemic load ⓘ Glycemic Load (GL) is a metric that measures both the quality (Glycemic Index) and quantity of carbohydrates in a specific serving of food to estimate its impact on blood sugar levels. It is calculated as: (GI × Carbs in grams) / 100. | 3 (low) |
| Net carbs ⓘ Net Carbs = Total Carbohydrates – Fiber – Sugar Alcohols | 7 g |
| Default serving size ⓘ Serving sizes are mostly taken from FDA's Reference Amounts Customarily Consumed (RACCs) | 3 oz (85 g) |
| Acidity (Based on PRAL) ⓘ PRAL (Potential renal acid load) is calculated using a formula. On the PRAL scale the higher the positive value, the more is the acidifying effect on the body. The lower the negative value, the higher the alkalinity of the food. 0 is neutral. | 15.2 (acidic) |
Vitamin B12 ⓘHigher in Vitamin B12 content than 99% of foods
Selenium ⓘHigher in Selenium content than 99% of foods
Manganese ⓘHigher in Manganese content than 99% of foods
Omega-3 - DHA ⓘHigher in Omega-3 - DHA content than 98% of foods
Omega-3 - EPA ⓘHigher in Omega-3 - EPA content than 98% of foods
Mussels calories (kcal)
| Calories for different serving sizes of mussels | Calories | Weight |
|---|---|---|
| Calories in 100 grams | 172 | |
| Calories in 3 oz | 146 | 85 g |
Extra Nutrition facts for Mussels
| Protein per 100 calories ⓘ Shows how many grams of protein you get from 100 calories of this food, calculated as (protein in g ÷ calories) × 100. | 14 g |
| Calories per 10 g protein ⓘ Shows how many calories you need to eat from this food to get 10 g of protein, calculated as (calories ÷ protein in g) × 10. | 72 kcal |
| Weight per 100 calories ⓘ Shows how many grams of this food equal 100 kcal—higher grams mean a larger portion for the same calories. | 58 g |
| Unsaturated / Saturated Fat ratio ⓘ (monounsaturated + polyunsaturated) / saturated, ≥2 broadly recommended by major guidelines for heart health | 2.6 |
| Taurine ⓘ Taurine is a sulfur-containing amino acid found in foods like seafood and meat that supports heart health, nerve function, and bile acid production. | 2.8 g ⓘ https://www.sciencedirect.com/science/article/abs/pii/S1096495906001606 |
| Glycogen ⓘ Glycogen is the stored form of glucose found in animals and shellfish, and when consumed it acts as a quickly available source of energy. | 4.2 g ⓘ https://www.researchgate.net/publication/365511896 |
| Iodine | 267 mcg ⓘ https://www.mdpi.com/2072-6643/13/4/1124 |
| Processing score ⓘ The processing score is a calculated value that looks at both how industrially made it is (NOVA) and how healthy/unprocessed the ingredients are (SIGA), then combines them into one score from 1 (least processed) to 4 (most processed). | 1 - Unprocessed ⓘ NOVA score = 1, SIGA score = A0 |
Mussels Glycemic index (GI)
Gi values are taken from various scientific sources. GI values less than 55 are considered as low. Values above 70 are considered as high.
Mussels Glycemic load (GL)
Mineral coverage chart
Mineral chart - relative view
Vitamin coverage chart
Vitamin A:
273µg of 900µg
30%
Vitamin E:
0mg of 15mg
0%
Vitamin D:
0µg of 20µg
0%
Vitamin C:
41mg of 90mg
45%
Vitamin B1:
0.9mg of 1mg
75%
Vitamin B2:
1.3mg of 1mg
97%
Vitamin B3:
9mg of 16mg
56%
Vitamin B5:
2.9mg of 5mg
57%
Vitamin B6:
0.3mg of 1mg
23%
Folate:
228µg of 400µg
57%
Vitamin B12:
72µg of 2µg
3000%
Vitamin K:
0µg of 120µg
0%
Vitamin chart - relative view
Macronutrients chart
Protein:
Daily Value: 48%
23.8 g of 50 g
23.8 g (48% of DV )
Fats:
Daily Value: 7%
4.5 g of 65 g
4.5 g (7% of DV )
Carbs:
Daily Value: 2%
7.4 g of 300 g
7.4 g (2% of DV )
Water:
Daily Value: 3%
61.2 g of 2,000 g
61.2 g (3% of DV )
Other:
3.2 g
3.2 g
Protein quality breakdown
Tryptophan:
801mg of 280mg
286%
Threonine:
3075mg of 1,050mg
293%
Isoleucine:
3108mg of 1,400mg
222%
Leucine:
5028mg of 2,730mg
184%
Lysine:
5337mg of 2,100mg
254%
Methionine:
1611mg of 1,050mg
153%
Phenylalanine:
2559mg of 1,750mg
146%
Valine:
3120mg of 1,820mg
171%
Histidine:
1371mg of 700mg
196%
Fat type information
Saturated fat:
0.85 g
Monounsaturated fat:
1 g
Polyunsaturated fat:
1.2 g
All nutrients for Mussels per 100g
| Nutrient | Value | DV% | In TOP % of foods | Comparison |
| Vitamin A | 91µg | 10% | 12% | |
| Calories | 172kcal | 9% | 55% |
3.7 times more than Orange
|
| Weight per 100 calories | 58g | N/A | 46% | |
| Protein | 24g | 57% | 15% |
8.4 times more than Broccoli
|
| Protein per 100 calories | 14g | N/A | 16% | |
| Calories per 10 g protein | 72kcal | N/A | 81% | |
| Unsaturated / Saturated Fat ratio | 2.6 | N/A | 32% | |
| Fats | 4.5g | 7% | 54% |
7.4 times less than Cheese
|
| Vitamin C | 14mg | 15% | 13% |
3.9 times less than Lemon
|
| Carbs | 7.4g | 2% | 55% |
3.8 times less than Rice
|
| Net carbs | 7.4g | N/A | 51% |
7.3 times less than Chocolate
|
| Cholesterol | 56mg | 19% | 31% |
6.7 times less than Egg
|
| Magnesium | 37mg | 9% | 19% |
3.8 times less than Almonds
|
| Calcium | 33mg | 3% | 39% |
3.8 times less than Milk
|
| Potassium | 268mg | 8% | 40% |
1.8 times more than Cucumber
|
| Iron | 6.7mg | 84% | 7% |
2.6 times more than Beef broiled
|
| Fiber | 0g | 0% | 100% |
N/A
|
| Copper | 0.15mg | 17% | 24% |
Equal to Shiitake
|
| Zinc | 2.7mg | 24% | 26% |
2.4 times less than Beef broiled
|
| Phosphorus | 285mg | 41% | 12% |
1.6 times more than Chicken meat
|
| Sodium | 369mg | 16% | 28% |
1.3 times less than White bread
|
| Manganese | 6.8mg | 296% | 1% | |
| Selenium | 90µg | 163% | 1% | |
| Vitamin B1 | 0.3mg | 25% | 21% |
1.1 times more than Pea raw
|
| Vitamin B2 | 0.42mg | 32% | 11% |
3.2 times more than Avocado
|
| Vitamin B3 | 3mg | 19% | 44% |
3.2 times less than Turkey meat
|
| Vitamin B5 | 0.95mg | 19% | 11% |
1.2 times less than Sunflower seeds
|
| Vitamin B6 | 0.1mg | 8% | 55% |
1.2 times less than Oats
|
| Vitamin B12 | 24µg | 1000% | 1% |
34.3 times more than Pork
|
| Folate | 76µg | 19% | 14% |
1.2 times more than Brussels sprouts
|
| Saturated fat | 0.85g | 4% | 60% |
6.9 times less than Beef broiled
|
| Monounsaturated fat | 1g | N/A | 57% |
9.7 times less than Avocado
|
| Polyunsaturated fat | 1.2g | N/A | 34% |
38.9 times less than Walnut
|
| Tryptophan | 0.27mg | 0% | 13% |
1.1 times less than Chicken meat
|
| Threonine | 1mg | 0% | 14% |
1.4 times more than Beef broiled
|
| Isoleucine | 1mg | 0% | 16% |
1.1 times more than Salmon raw
|
| Leucine | 1.7mg | 0% | 20% |
1.5 times less than Tuna Bluefin
|
| Lysine | 1.8mg | 0% | 20% |
3.9 times more than Tofu
|
| Methionine | 0.54mg | 0% | 22% |
5.6 times more than Quinoa
|
| Phenylalanine | 0.85mg | 0% | 20% |
1.3 times more than Egg
|
| Valine | 1mg | 0% | 20% |
2 times less than Soybean raw
|
| Histidine | 0.46mg | 0% | 29% |
1.6 times less than Turkey meat
|
| Omega-3 - EPA | 0.28g | N/A | 2% |
2.5 times less than Salmon
|
| Omega-3 - DHA | 0.51g | N/A | 2% |
2.9 times less than Salmon
|
| Omega-3 - DPA | 0.04g | N/A | 3% |
3.9 times less than Salmon
|
Check out similar food or compare with current

NUTRITION FACTS LABEL
Nutrition Facts
___servings per container
Serving Size ______________
Serving Size ______________
Amount Per 100g
Calories 172
% Daily Value*
6.9%
Total Fat
4.5g
3.9%
Saturated Fat 0.85g
0
Trans Fat
0g
19%
Cholesterol 56mg
16%
Sodium 369mg
2.5%
Total Carbohydrate
7.4g
0
Dietary Fiber
0g
Total Sugars 0g
Includes ? g Added Sugars
Protein
24g
Vitamin D
0mcg
0
Calcium
33mg
3.3%
Iron
6.7mg
84%
Potassium
268mg
7.9%
*
The % Daily Value (DV) tells you how much a nutrient in a serving of food contributes to a daily diet. 2,000 calories a day is used for general nutrition advice.
Health checks
ⓘ
Dietary cholesterol is not associated with an increased risk of coronary heart disease in healthy individuals. However, dietary cholesterol is common in foods that are high in harmful saturated fats.
Source
Low in Cholesterol
ⓘ
Trans fat consumption increases the risk of cardiovascular disease and mortality by negatively affecting blood lipid levels.
Source
No Trans Fats
ⓘ
Saturated fat intake can raise total cholesterol and LDL (low-density lipoprotein) levels, leading to an increased risk of atherosclerosis. Dietary guidelines recommend limiting saturated fats to under 10% of calories a day.
Source
Low in Saturated Fats
ⓘ
While the consumption of moderate amounts of added sugars is not detrimental to health, an excessive intake can increase the risk of obesity, and therefore, diabetes.
Source
Low in Sugars
Mussels nutrition infographic
Infographic link
References
All the values for which the sources are not specified explicitly are taken from FDA’s Food Central. The exact link to the food presented on this page can be found below.