Nectarine vs. Plum — Nutrition Comparison and Health Impact


Summary
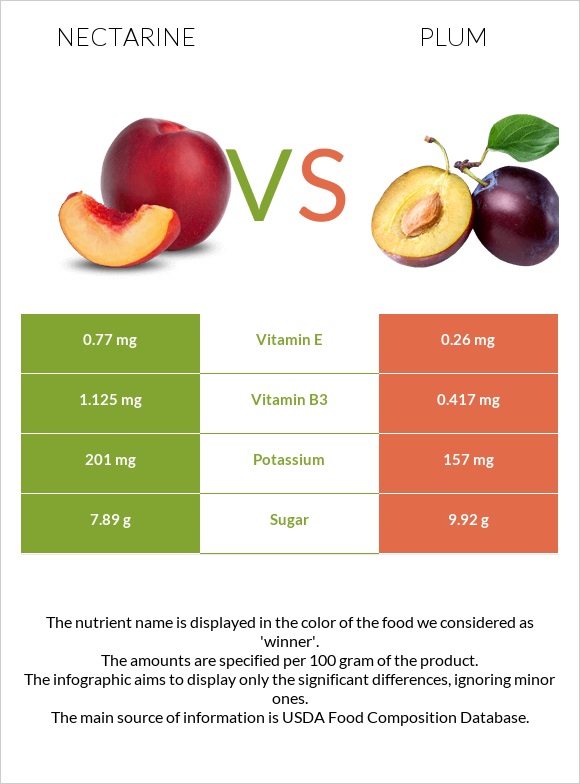
Nectarines are richer in minerals, particularly magnesium, phosphorus, and potassium. They also have more vitamin B1 and vitamin B3, and fiber.
On the other hand, plums have two times more vitamin C than nectarines. Plums are also richer in vitamin A and vitamin K.
Introduction
Both being members of the Rosaceae family, the plum and nectarine have a lot of similarities. These juicy fruits are packed with vitamins, carbohydrates, and minerals. On the other hand, plums and nectarines differ in nutrient content. This article will discuss the general and nutritional differences and the health impacts of raw nectarines (1) and plums (2).
Taste and Appearance
The two fruits are from the same family (Rosaceae), so they share much. However, they differ in scent, color, and appearance.
Plums (Prunus domestica) are known for their red-purplish color and smooth, oval-sized exterior. Plums are native to China. They usually taste sweet or tangy.
The color of nectarines (Prunus persica var. nucipersica) is red, yellow, or white. They are larger than plums; their skin is not fuzzy. This is because the recessive allele responsible for soft skin is expressed in nectarines (3). The smell of nectarine is sweet, juicy, and peachy.
Nutrition
Vitamins
Vitamins are nutrients the human body cannot produce. Vitamins are abundant in fruits such as plums and nectarines.
Plums are high in vitamins C, B6, and K, although nectarines have more B1, B3, B5, and E.
Plums offer nearly twice as much vitamin C as nectarines, with 9.5mg per 100g compared to 5.4mg in nectarines.
For more detailed information, check the vitamin comparison chart below.
Vitamin Comparison
Contains
more
Vitamin EVitamin E
+196.2%
Contains
more
Vitamin B1Vitamin B1
+21.4%
Contains
more
Vitamin B3Vitamin B3
+169.8%
Contains
more
Vitamin B5Vitamin B5
+37%
Contains
more
Vitamin CVitamin C
+75.9%
Contains
more
Vitamin B6Vitamin B6
+16%
Contains
more
Vitamin KVitamin K
+190.9%
Minerals
Nectarine is the absolute winner in this section.
Nectarine is higher in iron, magnesium, phosphorus, potassium, zinc, and copper than common plum.
Mineral Comparison
Contains
more
MagnesiumMagnesium
+28.6%
Contains
more
PotassiumPotassium
+28%
Contains
more
IronIron
+64.7%
Contains
more
CopperCopper
+50.9%
Contains
more
ZincZinc
+70%
Contains
more
PhosphorusPhosphorus
+62.5%
Protein
Nectarines provide more protein than plums. They contain 1.1g per 100g of fruit, compared to 0.7g in plums.
Carbs
Large quantities of these chemicals can be found in all fruits. Plums have more carbs than nectarines. Plums have 11.4g of carbohydrates per 100g, while nectarines have 10.5g. Furthermore, nectarines have fewer sugars than plums. They contain less fructose but more starch.
Fiber
Nectarines are high in both forms of fiber, but especially soluble fibers, which help keep healthy blood glucose and cholesterol levels. The fiber level of nectarines is higher than that of plums. They have 1.7 grams of fiber per 100 grams of fruit, compared with 1.4 grams of plums.
Net carbs
Net carbs are the carbohydrates in food used to synthesize energy. You should subtract the amount of fiber from the total carbs in the food to get at this amount.
Plums provide 11.4 grams of carbs with 1.4 grams of fiber. On the other hand, nectarines provide 10.5 grams of carbohydrates and 1.7 grams of fiber per serving. Plums have 10 grams of net carbs, whereas nectarines have 8.8 grams. Finally, nectarines have a lower net carb content.
Carbohydrate type comparison
Contains
more
StarchStarch
+∞%
Contains
more
SucroseSucrose
+210.2%
Contains
more
GlucoseGlucose
+222.9%
Contains
more
FructoseFructose
+124.1%
Contains
more
MaltoseMaltose
+∞%
Contains
more
GalactoseGalactose
+∞%
Fats
Lipids are not found in plums or nectarines in considerable quantities. Plums have 0.28 grams of fat per 100 grams of fruit, whereas nectarines have 0.32 grams. The two fruits are equal in cholesterol content: they do not contain a significant amount.
Glycemic Index
The glycemic index of nectarines is lower than that of plums.
Nectarines have a glycemic index equal to 43, while plums have a GI equal to 53.
Nonetheless, both are considered low-GI foods.
Calories
Plums and nectarines have almost similar amounts of calories. However, the plum has 46 calories per 100g of fruit, compared to 44 for nectarines.
Health Impact
Cardiovascular Health
Using nectarines and plums regularly may improve cardiovascular health. Both of them generate a significant quantity of compounds that support heart health.
This study found no beneficial effects of plums on blood pressure. On the other hand, another study indicates that eating plums may lower diastolic blood pressure. Based on these, further research is required for more accurate information (4.5). This effect is unknown for nectarine.
According to studies, plum, and nectarine consumption may reduce LDL (bad cholesterol) levels in the blood. This effect is important for people with coronary artery disease (6.7.8).
Antioxidants
Toxic free radicals of oxygen can cause oxidative stress and kill all cells. Thus, antioxidants help to neutralize them (9). As a result, oxidative stress may cause cardiovascular disease (10), obesity (11), and Alzheimer's disease. Plums and nectarines are both high in antioxidants. These two fruits play a similar role in the organism's antioxidant defense.
Plums are especially rich in polyphenols, which defend against heart disease and diabetes (12). Research shows that plums provide nearly two times more polyphenols than nectarines and peaches (13).
Flavonoids and anthocyanins are nectarine antioxidants contributing to the fruit's flavor, scent, and appearance (14). Flavonoids help prevent age-related brain damage, whereas anthocyanins help reduce the risk of inflammation and heart disease (15).
Diabetes
These two fruits are good choices for people with diabetes. Plums help to regulate sugar levels by producing special chemicals. Nectarines are involved in maintaining blood glucose levels with the antioxidants they contain.
Consuming plums boosts adiponectin levels: this hormone is essential in blood sugar management (16). Plum consumption is also linked with a lower risk of type 2 diabetes (17).
Nectarines' four major phenolic groups are catechins, anthocyanins, chlorogenic acids, and quercetins. These phenolic compounds are antioxidants with anti-inflammatory and anti-obesity properties (18).
References
- https://fdc.nal.usda.gov/fdc-app.html#/food-details/169914/nutrients
- https://fdc.nal.usda.gov/fdc-app.html#/food-details/169949/nutrients
- https://www.ncbi.nlm.nih.gov/pmc/articles/PMC3940905/
- https://pubmed.ncbi.nlm.nih.gov/36513468/
- https://www.ffhdj.com/index.php/ffhd/article/view/394
- https://pubmed.ncbi.nlm.nih.gov/36721717/
- https://www.actahort.org/books/841/841_32.htm
- https://pubmed.ncbi.nlm.nih.gov/22650003/
- https://www.ncbi.nlm.nih.gov/pmc/articles/PMC2684512/
- https://pubmed.ncbi.nlm.nih.gov/28230726/
- https://www.ncbi.nlm.nih.gov/pmc/articles/PMC4307252/
- https://pubmed.ncbi.nlm.nih.gov/26992121/
- https://pubmed.ncbi.nlm.nih.gov/12166993/
- https://www.ncbi.nlm.nih.gov/pmc/articles/PMC3211018/
- https://pubmed.ncbi.nlm.nih.gov/26761031/
- https://www.ncbi.nlm.nih.gov/pmc/articles/PMC4058731/
- https://www.bmj.com/content/347/bmj.f5001
- Peaches, plums, and nectarines give obesity, and diabetes slim chance

Infographic
All nutrients comparison - raw data values
| Nutrient | |
|
DV% diff. |
| Vitamin C | 5.4mg | 9.5mg | 5% |
| Vitamin B3 | 1.125mg | 0.417mg | 4% |
| Vitamin K | 2.2µg | 6.4µg | 4% |
| Copper | 0.086mg | 0.057mg | 3% |
| Vitamin E | 0.77mg | 0.26mg | 3% |
| Fructose | 1.37g | 3.07g | 2% |
| Protein | 1.06g | 0.7g | 1% |
| Potassium | 201mg | 157mg | 1% |
| Iron | 0.28mg | 0.17mg | 1% |
| Fiber | 1.7g | 1.4g | 1% |
| Zinc | 0.17mg | 0.1mg | 1% |
| Phosphorus | 26mg | 16mg | 1% |
| Vitamin B1 | 0.034mg | 0.028mg | 1% |
| Vitamin B5 | 0.185mg | 0.135mg | 1% |
| Choline | 6.2mg | 1.9mg | 1% |
| Calories | 44kcal | 46kcal | 0% |
| Protein per 100 calories | 2.4g | 1.5g | N/A |
| Calories per 10 g protein | 415kcal | 657kcal | N/A |
| Weight per 100 calories | 227g | 217g | N/A |
| Fats | 0.32g | 0.28g | 0% |
| Net carbs | 8.85g | 10.02g | N/A |
| Carbs | 10.55g | 11.42g | 0% |
| Magnesium | 9mg | 7mg | 0% |
| Calcium | 6mg | 6mg | 0% |
| Sugar | 7.89g | 9.92g | N/A |
| Starch | 0.07g | 0g | 0% |
| Vitamin A | 17µg | 17µg | 0% |
| Manganese | 0.054mg | 0.052mg | 0% |
| Vitamin B2 | 0.027mg | 0.026mg | 0% |
| Vitamin B6 | 0.025mg | 0.029mg | 0% |
| Folate | 5µg | 5µg | 0% |
| Saturated fat | 0.025g | 0.017g | 0% |
| Monounsaturated fat | 0.088g | 0.134g | 0% |
| Polyunsaturated fat | 0.113g | 0.044g | 0% |
| Tryptophan | 0.005mg | 0.009mg | 0% |
| Threonine | 0.009mg | 0.01mg | 0% |
| Isoleucine | 0.009mg | 0.014mg | 0% |
| Leucine | 0.014mg | 0.015mg | 0% |
| Lysine | 0.016mg | 0.016mg | 0% |
| Methionine | 0.006mg | 0.008mg | 0% |
| Phenylalanine | 0.021mg | 0.014mg | 0% |
| Valine | 0.013mg | 0.016mg | 0% |
| Histidine | 0.008mg | 0.009mg | 0% |
Macronutrient Comparison
| Contains more ProteinProtein | +51.4% |
| Contains more FatsFats | +14.3% |
| Contains more OtherOther | +29.7% |
Fat Type Comparison
| Contains more Poly. FatPolyunsaturated fat | +156.8% |
| Contains less Sat. FatSaturated fat | -32% |
| Contains more Mono. FatMonounsaturated fat | +52.3% |
People also compare


References
All the values for which the sources are not specified explicitly are taken from FDA’s Food Central. The exact link to the food presented on this page can be found below.
- Nectarine - https://fdc.nal.usda.gov/fdc-app.html#/food-details/169914/nutrients
- Plum - https://fdc.nal.usda.gov/fdc-app.html#/food-details/169949/nutrients
All the Daily Values are presented for males aged 31-50, for 2000-calorie diets.