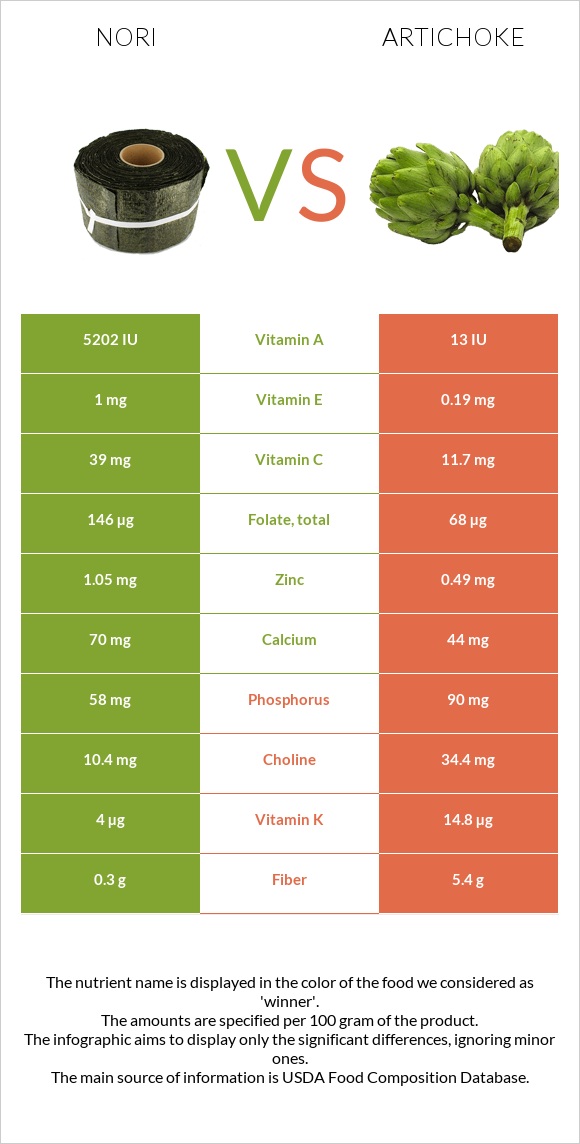
Summary of differences between nori and artichoke Nori has more vitamin A, manganese, vitamin C, vitamin B2, folate, iron, and vitamin E; however, artichoke is higher in fiber, magnesium, and vitamin K. Nori covers your daily need for vitamin A, 104% more than artichoke. Nori has 7 times more vitamin B2 than artichoke. While nori has 0.446mg of vitamin B2, artichoke has only 0.066mg. These are the specific foods used in this comparison Seaweed, laver, raw and Artichokes, (globe or french), raw .
Infographic
Mineral Comparison
Mineral comparison score is based on the number of minerals by which one or the other food is richer. The "coverage" charts below show how much of the daily needs can be covered by 300 grams of the food.
7
100 g
300 g
2 tbsp (1/8 cup) - 10g 10 sheets - 26g
Magnesium
Magnesium
Calcium
Calcium
Potassium
Potassium
Iron
Iron
Copper
Copper
Zinc
Zinc
Phosphorus
Phosphorus
Sodium
Sodium
Manganese
Manganese
Selenium
Selenium
1.4%
21%
31%
68%
88%
29%
25%
6.3%
129%
3.8%
2
100 g
300 g
1 artichoke, medium - 128g 1 artichoke, large - 162g
Magnesium
Magnesium
Calcium
Calcium
Potassium
Potassium
Iron
Iron
Copper
Copper
Zinc
Zinc
Phosphorus
Phosphorus
Sodium
Sodium
Manganese
Manganese
Selenium
Selenium
43%
13%
33%
48%
77%
13%
39%
12%
33%
1.1%
Vitamin Comparison
Vitamin comparison score is based on the number of vitamins by which one or the other food is richer. The "coverage" charts below show how much of the daily needs can be covered by 300 grams of the food.
9
100 g
300 g
2 tbsp (1/8 cup) - 10g 10 sheets - 26g
Vitamin C
Vit. C
Vitamin D
Vit. D
Vitamin A
Vit. A
Vitamin E
Vit. E
Vitamin B1
Vit. B1
Vitamin B2
Vit. B2
Vitamin B3
Vit. B3
Vitamin B5
Vit. B5
Vitamin B6
Vit. B6
Vitamin B12
Vit. B12
Vitamin K
Vit. K
Folate
Folate
130%
0%
87%
20%
25%
103%
28%
31%
37%
0%
10%
110%
1
100 g
300 g
1 artichoke, medium - 128g 1 artichoke, large - 162g
Vitamin C
Vit. C
Vitamin D
Vit. D
Vitamin A
Vit. A
Vitamin E
Vit. E
Vitamin B1
Vit. B1
Vitamin B2
Vit. B2
Vitamin B3
Vit. B3
Vitamin B5
Vit. B5
Vitamin B6
Vit. B6
Vitamin B12
Vit. B12
Vitamin K
Vit. K
Folate
Folate
39%
0%
0.33%
3.8%
18%
15%
20%
20%
27%
0%
37%
51%
All nutrients comparison - raw data values
Nutrient
DV% diff.
Manganese
0.988mg
0.256mg
32%
Vitamin C
39mg
11.7mg
30%
Vitamin A
260µg
1µg
29%
Vitamin B2
0.446mg
0.066mg
29%
Fiber
0.3g
5.4g
20%
Folate
146µg
68µg
20%
Magnesium
2mg
60mg
14%
Vitamin K
4µg
14.8µg
9%
Iron
1.8mg
1.28mg
7%
Protein
5.81g
3.27g
5%
Zinc
1.05mg
0.49mg
5%
Phosphorus
58mg
90mg
5%
Vitamin E
1mg
0.19mg
5%
Copper
0.264mg
0.231mg
4%
Vitamin B5
0.521mg
0.338mg
4%
Choline
10.4mg
34.4mg
4%
Calcium
70mg
44mg
3%
Vitamin B3
1.47mg
1.046mg
3%
Vitamin B6
0.159mg
0.116mg
3%
Carbs
5.11g
10.51g
2%
Sodium
48mg
94mg
2%
Vitamin B1
0.098mg
0.072mg
2%
Calories
35kcal
47kcal
1%
Selenium
0.7µg
0.2µg
1%
Protein per 100 calories
17g
7g
N/A
Calories per 10 g protein
60kcal
144kcal
N/A
Weight per 100 calories
286g
213g
N/A
Fats
0.28g
0.15g
0%
Net carbs
4.81g
5.11g
N/A
Potassium
356mg
370mg
0%
Sugar
0.49g
0.99g
N/A
Saturated fat
0.061g
0.036g
0%
Monounsaturated fat
0.025g
0.005g
0%
Polyunsaturated fat
0.11g
0.064g
0%
Tryptophan
0.043mg
0%
Threonine
0.232mg
0%
Isoleucine
0.259mg
0%
Leucine
0.501mg
0%
Lysine
0.222mg
0%
Methionine
0.145mg
0%
Phenylalanine
0.273mg
0%
Valine
0.402mg
0%
Histidine
0.14mg
0%
Omega-3 - EPA
0.08g
0g
N/A
Macronutrient Comparison
Macronutrient breakdown side-by-side comparison
4
6%
5%
85%
4%
Protein:
5.81 g
Fats:
0.28 g
Carbs:
5.11 g
Water:
85.03 g
Other:
3.77 g
1
3%
11%
85%
Protein:
3.27 g
Fats:
0.15 g
Carbs:
10.51 g
Water:
84.94 g
Other:
1.13 g
Contains
more
Protein Protein
+77.7%
Contains
more
Fats Fats
+86.7%
Contains
more
Other Other
+233.6%
Contains
more
Carbs Carbs
+105.7%
Fat Type Comparison
Fat type breakdown side-by-side comparison
2
31%
13%
56%
Saturated fat:
Sat. Fat
0.061 g
Monounsaturated fat:
Mono. Fat
0.025 g
Polyunsaturated fat:
Poly. Fat
0.11 g
1
34%
5%
61%
Saturated fat:
Sat. Fat
0.036 g
Monounsaturated fat:
Mono. Fat
0.005 g
Polyunsaturated fat:
Poly. Fat
0.064 g
Contains
more
Mono. Fat Monounsaturated fat
+400%
Contains
more
Poly. Fat Polyunsaturated fat
+71.9%
Contains
less
Sat. Fat Saturated fat
-41%