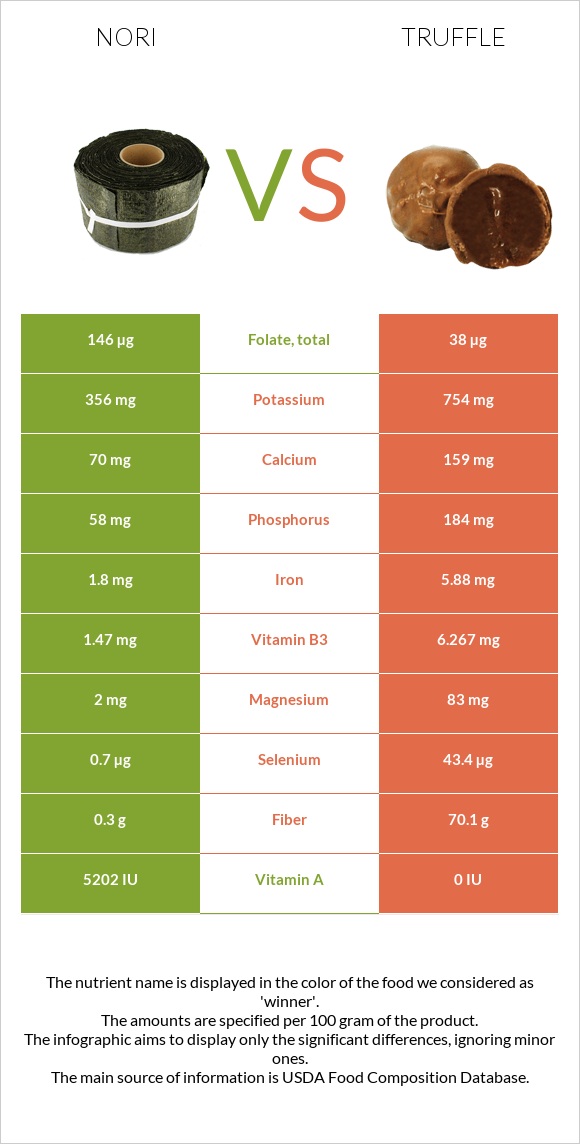
The main differences between nori and truffle Nori is richer in vitamin A, vitamin C, and folate, yet truffle is richer in fiber, selenium, iron, manganese, vitamin B2, vitamin B3, and magnesium. Daily need coverage for fiber for truffle is 279% higher. Food types used in this article are Seaweed, laver, raw and Fungi, Cloud ears, dried .
Infographic
Mineral Comparison
Mineral comparison score is based on the number of minerals by which one or the other food is richer. The "coverage" charts below show how much of the daily needs can be covered by 300 grams of the food.
1
100 g
300 g
2 tbsp (1/8 cup) - 10g 10 sheets - 26g
Magnesium
Magnesium
Calcium
Calcium
Potassium
Potassium
Iron
Iron
Copper
Copper
Zinc
Zinc
Phosphorus
Phosphorus
Sodium
Sodium
Manganese
Manganese
Selenium
Selenium
1.4%
21%
31%
68%
88%
29%
25%
6.3%
129%
3.8%
9
100 g
300 g
1 piece - 4.5g 1 cup - 28g
Magnesium
Magnesium
Calcium
Calcium
Potassium
Potassium
Iron
Iron
Copper
Copper
Zinc
Zinc
Phosphorus
Phosphorus
Sodium
Sodium
Manganese
Manganese
Selenium
Selenium
59%
48%
67%
221%
61%
36%
79%
4.6%
254%
237%
Vitamin Comparison
Vitamin comparison score is based on the number of vitamins by which one or the other food is richer. The "coverage" charts below show how much of the daily needs can be covered by 300 grams of the food.
7
100 g
300 g
2 tbsp (1/8 cup) - 10g 10 sheets - 26g
Vitamin C
Vit. C
Vitamin D
Vit. D
Vitamin A
Vit. A
Vitamin E
Vit. E
Vitamin B1
Vit. B1
Vitamin B2
Vit. B2
Vitamin B3
Vit. B3
Vitamin B5
Vit. B5
Vitamin B6
Vit. B6
Vitamin B12
Vit. B12
Vitamin K
Vit. K
Folate
Folate
130%
0%
87%
20%
25%
103%
28%
31%
37%
0%
10%
110%
2
100 g
300 g
1 piece - 4.5g 1 cup - 28g
Vitamin C
Vit. C
Vitamin D
Vit. D
Vitamin A
Vit. A
Vitamin E
Vit. E
Vitamin B1
Vit. B1
Vitamin B2
Vit. B2
Vitamin B3
Vit. B3
Vitamin B5
Vit. B5
Vitamin B6
Vit. B6
Vitamin B12
Vit. B12
Vitamin K
Vit. K
Folate
Folate
0%
0%
0%
0%
3.8%
195%
118%
29%
26%
0%
0%
29%
All nutrients comparison - raw data values
Nutrient
DV% diff.
Fiber
0.3g
70.1g
279%
Selenium
0.7µg
43.4µg
78%
Iron
1.8mg
5.88mg
51%
Vitamin C
39mg
0mg
43%
Manganese
0.988mg
1.951mg
42%
Vitamin B2
0.446mg
0.844mg
31%
Vitamin B3
1.47mg
6.267mg
30%
Vitamin A
260µg
0µg
29%
Folate
146µg
38µg
27%
Carbs
5.11g
73.01g
23%
Magnesium
2mg
83mg
19%
Phosphorus
58mg
184mg
18%
Calories
35kcal
284kcal
12%
Potassium
356mg
754mg
12%
Calcium
70mg
159mg
9%
Copper
0.264mg
0.183mg
9%
Protein
5.81g
9.25g
7%
Vitamin E
1mg
7%
Vitamin B1
0.098mg
0.015mg
7%
Vitamin B6
0.159mg
0.112mg
4%
Vitamin K
4µg
3%
Zinc
1.05mg
1.32mg
2%
Choline
10.4mg
2%
Fats
0.28g
0.73g
1%
Sodium
48mg
35mg
1%
Vitamin B5
0.521mg
0.481mg
1%
Polyunsaturated fat
0.11g
1%
Protein per 100 calories
17g
3.3g
N/A
Calories per 10 g protein
60kcal
307kcal
N/A
Weight per 100 calories
286g
35g
N/A
Net carbs
4.81g
2.91g
N/A
Sugar
0.49g
N/A
Saturated fat
0.061g
0%
Monounsaturated fat
0.025g
0%
Tryptophan
0.043mg
0%
Threonine
0.232mg
0%
Isoleucine
0.259mg
0%
Leucine
0.501mg
0%
Lysine
0.222mg
0%
Methionine
0.145mg
0%
Phenylalanine
0.273mg
0%
Valine
0.402mg
0%
Histidine
0.14mg
0%
Omega-3 - EPA
0.08g
N/A
Macronutrient Comparison
Macronutrient breakdown side-by-side comparison
2
6%
5%
85%
4%
Protein:
5.81 g
Fats:
0.28 g
Carbs:
5.11 g
Water:
85.03 g
Other:
3.77 g
3
9%
73%
15%
2%
Protein:
9.25 g
Fats:
0.73 g
Carbs:
73.01 g
Water:
14.8 g
Other:
2.21 g
Contains
more
Water Water
+474.5%
Contains
more
Other Other
+70.6%
Contains
more
Protein Protein
+59.2%
Contains
more
Fats Fats
+160.7%
Contains
more
Carbs Carbs
+1328.8%