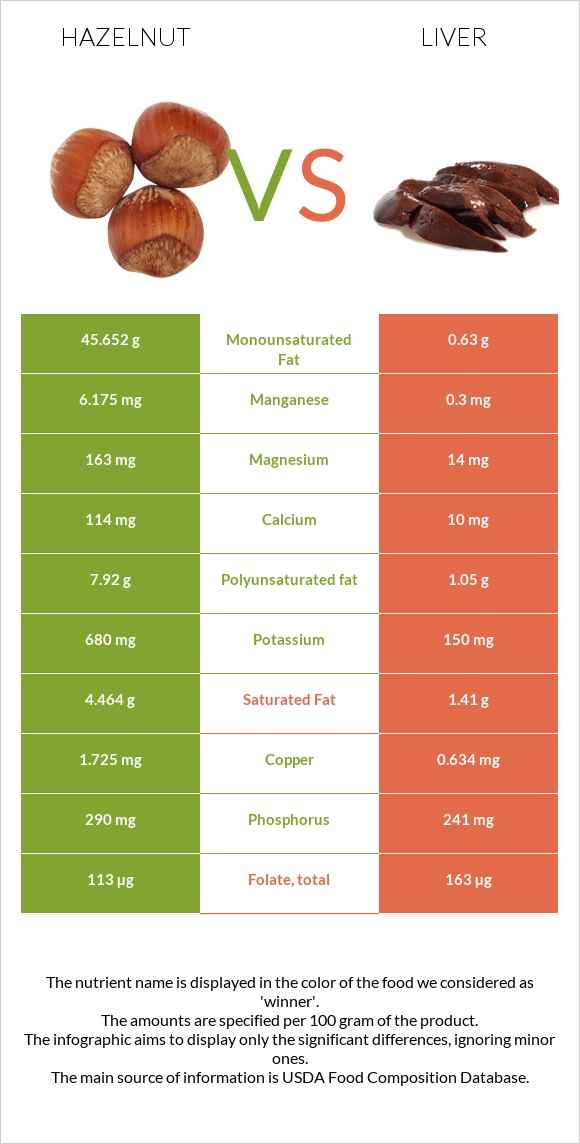
Differences between hazelnut and liver Hazelnut is higher in manganese and copper; however, liver is richer in vitamin B12, vitamin A, iron, vitamin B2, selenium, vitamin B5, and vitamin B3. Liver's daily need coverage for vitamin B12 is 778% higher. Hazelnut has 21 times more manganese than liver. While hazelnut has 6.175mg of manganese, liver has only 0.3mg. Liver has a lower glycemic index (0) than hazelnut (15). The food types used in this comparison are Nuts, hazelnuts or filberts and Pork, fresh, variety meats, and by-products, liver, cooked, braised .
Infographic
Mineral Comparison
Mineral comparison score is based on the number of minerals by which one or the other food is richer. The "coverage" charts below show how much of the daily needs can be covered by 300 grams of the food.
7
100 g
300 g
10 nuts - 14g 1 oz (21 whole kernels) - 28.35g 1 cup, ground - 75g 1 cup, chopped - 115g 1 cup, whole - 135g
Magnesium
Magnesium
Calcium
Calcium
Potassium
Potassium
Iron
Iron
Copper
Copper
Zinc
Zinc
Phosphorus
Phosphorus
Sodium
Sodium
Manganese
Manganese
Selenium
Selenium
116%
34%
60%
176%
575%
67%
124%
0%
805%
13%
3
100 g
300 g
3 oz - 85g
Magnesium
Magnesium
Calcium
Calcium
Potassium
Potassium
Iron
Iron
Copper
Copper
Zinc
Zinc
Phosphorus
Phosphorus
Sodium
Sodium
Manganese
Manganese
Selenium
Selenium
10%
3%
13%
672%
211%
183%
103%
6.4%
39%
368%
Vitamin Comparison
Vitamin comparison score is based on the number of vitamins by which one or the other food is richer. The "coverage" charts below show how much of the daily needs can be covered by 300 grams of the food.
3
100 g
300 g
10 nuts - 14g 1 oz (21 whole kernels) - 28.35g 1 cup, ground - 75g 1 cup, chopped - 115g 1 cup, whole - 135g
Vitamin C
Vit. C
Vitamin D
Vit. D
Vitamin A
Vit. A
Vitamin E
Vit. E
Vitamin B1
Vit. B1
Vitamin B2
Vit. B2
Vitamin B3
Vit. B3
Vitamin B5
Vit. B5
Vitamin B6
Vit. B6
Vitamin B12
Vit. B12
Vitamin K
Vit. K
Folate
Folate
21%
0%
0.33%
301%
161%
26%
34%
55%
130%
0%
36%
85%
7
100 g
300 g
3 oz - 85g
Vitamin C
Vit. C
Vitamin D
Vit. D
Vitamin A
Vit. A
Vitamin E
Vit. E
Vitamin B1
Vit. B1
Vitamin B2
Vit. B2
Vitamin B3
Vit. B3
Vitamin B5
Vit. B5
Vitamin B6
Vit. B6
Vitamin B12
Vit. B12
Vitamin K
Vit. K
Folate
Folate
79%
0%
1802%
0%
65%
507%
158%
286%
132%
2334%
0%
122%
All nutrients comparison - raw data values
Nutrient
DV% diff.
Vitamin B12
0µg
18.67µg
778%
Vitamin A
1µg
5405µg
600%
Manganese
6.175mg
0.3mg
255%
Iron
4.7mg
17.92mg
165%
Vitamin B2
0.113mg
2.196mg
160%
Copper
1.725mg
0.634mg
121%
Cholesterol
0mg
355mg
118%
Selenium
2.4µg
67.5µg
118%
Monounsaturated fat
45.652g
0.63g
113%
Vitamin E
15.03mg
100%
Fats
60.75g
4.4g
87%
Vitamin B5
0.918mg
4.774mg
77%
Polyunsaturated fat
7.92g
1.05g
46%
Vitamin B3
1.8mg
8.435mg
41%
Fiber
9.7g
0g
39%
Zinc
2.45mg
6.72mg
39%
Magnesium
163mg
14mg
35%
Vitamin B1
0.643mg
0.258mg
32%
Calories
628kcal
165kcal
23%
Protein
14.95g
26.02g
22%
Vitamin C
6.3mg
23.6mg
19%
Potassium
680mg
150mg
16%
Saturated fat
4.464g
1.41g
14%
Folate
113µg
163µg
13%
Vitamin K
14.2µg
12%
Calcium
114mg
10mg
10%
Choline
45.6mg
8%
Phosphorus
290mg
241mg
7%
Carbs
16.7g
3.76g
4%
Sodium
0mg
49mg
2%
Vitamin B6
0.563mg
0.57mg
1%
Protein per 100 calories
2.4g
16g
N/A
Calories per 10 g protein
420kcal
63kcal
N/A
Weight per 100 calories
16g
61g
N/A
Unsaturated / Saturated Fat ratio
12
1.2
N/A
Net carbs
7g
3.76g
N/A
Sugar
4.34g
N/A
Starch
0.48g
0%
Tryptophan
0.193mg
0.366mg
0%
Threonine
0.497mg
1.107mg
0%
Isoleucine
0.545mg
1.32mg
0%
Leucine
1.063mg
2.319mg
0%
Lysine
0.42mg
2.007mg
0%
Methionine
0.221mg
0.645mg
0%
Phenylalanine
0.663mg
1.274mg
0%
Valine
0.701mg
1.607mg
0%
Histidine
0.432mg
0.708mg
0%
Fructose
0.07g
0%
Omega-3 - DHA
0g
0.03g
N/A
Omega-3 - DPA
0g
0.04g
N/A
Macronutrient Comparison
Macronutrient breakdown side-by-side comparison
3
15%
61%
17%
5%
2%
Protein:
14.95 g
Fats:
60.75 g
Carbs:
16.7 g
Water:
5.31 g
Other:
2.29 g
2
26%
4%
4%
64%
Protein:
26.02 g
Fats:
4.4 g
Carbs:
3.76 g
Water:
64.32 g
Other:
1.5 g
Contains
more
Fats Fats
+1280.7%
Contains
more
Carbs Carbs
+344.1%
Contains
more
Other Other
+52.7%
Contains
more
Protein Protein
+74%
Contains
more
Water Water
+1111.3%
Fat Type Comparison
Fat type breakdown side-by-side comparison
2
8%
79%
14%
Saturated fat:
Sat. Fat
4.464 g
Monounsaturated fat:
Mono. Fat
45.652 g
Polyunsaturated fat:
Poly. Fat
7.92 g
1
46%
20%
34%
Saturated fat:
Sat. Fat
1.41 g
Monounsaturated fat:
Mono. Fat
0.63 g
Polyunsaturated fat:
Poly. Fat
1.05 g
Contains
more
Mono. Fat Monounsaturated fat
+7146.3%
Contains
more
Poly. Fat Polyunsaturated fat
+654.3%
Contains
less
Sat. Fat Saturated fat
-68.4%