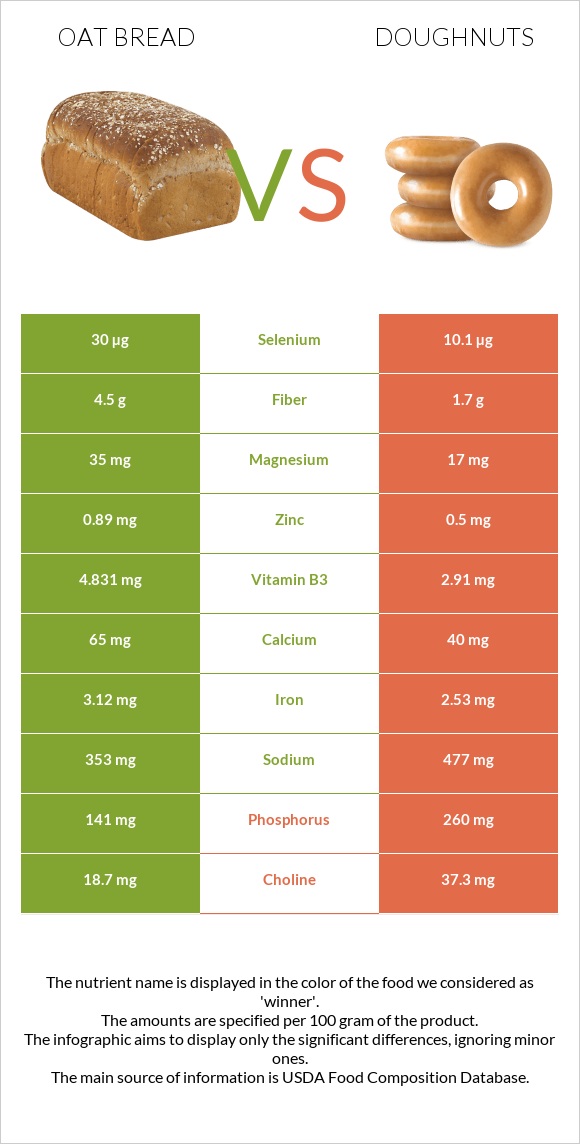
A recap on the differences between oat bread and doughnuts Oat bread is higher in selenium, manganese, vitamin B3, fiber, vitamin B1, and iron, yet doughnuts are higher in phosphorus, vitamin E, and vitamin K. Doughnuts cover your daily saturated fat needs 52% more than oat bread. Oat bread contains 3 times more selenium than doughnuts. While oat bread contains 30µg of selenium, doughnuts contain only 10.1µg. The amount of saturated fat in oat bread is lower. The glycemic index of oat bread is lower. Food varieties used in this article are Bread, oat bran and Doughnuts, cake-type, plain (includes unsugared, old-fashioned) .
Infographic
Mineral Comparison
Mineral comparison score is based on the number of minerals by which one or the other food is richer. The "coverage" charts below show how much of the daily needs can be covered by 300 grams of the food.
8
100 g
300 g
1 oz - 28.35g 1 slice - 30g
Magnesium
Magnesium
Calcium
Calcium
Potassium
Potassium
Iron
Iron
Copper
Copper
Zinc
Zinc
Phosphorus
Phosphorus
Sodium
Sodium
Manganese
Manganese
Selenium
Selenium
25%
20%
13%
117%
45%
24%
60%
46%
102%
164%
1
100 g
300 g
1 doughnut, mini (1-1/2" dia) or doughnut hole - 14g 1 oz - 28.35g 1 donut - 40g 1 doughnut stick - 52g 1 doughnut, long type (twist) (4-1/2" long) - 52g 1 doughnut medium (3-1/4" dia) - 54g 1 doughnut, large (4" dia) - 71g
Magnesium
Magnesium
Calcium
Calcium
Potassium
Potassium
Iron
Iron
Copper
Copper
Zinc
Zinc
Phosphorus
Phosphorus
Sodium
Sodium
Manganese
Manganese
Selenium
Selenium
12%
12%
12%
95%
30%
14%
111%
62%
43%
55%
Vitamin Comparison
Vitamin comparison score is based on the number of vitamins by which one or the other food is richer. The "coverage" charts below show how much of the daily needs can be covered by 300 grams of the food.
5
100 g
300 g
1 oz - 28.35g 1 slice - 30g
Vitamin C
Vit. C
Vitamin D
Vit. D
Vitamin A
Vit. A
Vitamin E
Vit. E
Vitamin B1
Vit. B1
Vitamin B2
Vit. B2
Vitamin B3
Vit. B3
Vitamin B5
Vit. B5
Vitamin B6
Vit. B6
Vitamin B12
Vit. B12
Vitamin K
Vit. K
Folate
Folate
0%
0%
0.67%
8.8%
126%
80%
91%
35%
17%
0%
3%
61%
5
100 g
300 g
1 doughnut, mini (1-1/2" dia) or doughnut hole - 14g 1 oz - 28.35g 1 donut - 40g 1 doughnut stick - 52g 1 doughnut, long type (twist) (4-1/2" long) - 52g 1 doughnut medium (3-1/4" dia) - 54g 1 doughnut, large (4" dia) - 71g
Vitamin C
Vit. C
Vitamin D
Vit. D
Vitamin A
Vit. A
Vitamin E
Vit. E
Vitamin B1
Vit. B1
Vitamin B2
Vit. B2
Vitamin B3
Vit. B3
Vitamin B5
Vit. B5
Vitamin B6
Vit. B6
Vitamin B12
Vit. B12
Vitamin K
Vit. K
Folate
Folate
0%
0%
1.3%
40%
98%
69%
55%
23%
12%
7.5%
25%
69%
All nutrients comparison - raw data values
Nutrient
DV% diff.
Saturated fat
0.697g
11.105g
47%
Selenium
30µg
10.1µg
36%
Fats
4.4g
24.93g
32%
Manganese
0.779mg
0.333mg
19%
Phosphorus
141mg
260mg
17%
Monounsaturated fat
1.59g
8.544g
17%
Polyunsaturated fat
1.694g
3.915g
15%
Vitamin B3
4.831mg
2.91mg
12%
Fiber
4.5g
1.7g
11%
Starch
25.91g
11%
Calories
236kcal
434kcal
10%
Protein
10.4g
5.31g
10%
Vitamin E
0.44mg
1.99mg
10%
Vitamin B1
0.504mg
0.39mg
10%
Iron
3.12mg
2.53mg
7%
Vitamin K
1.2µg
9.8µg
7%
Copper
0.135mg
0.09mg
5%
Sodium
353mg
477mg
5%
Magnesium
35mg
17mg
4%
Zinc
0.89mg
0.5mg
4%
Vitamin B5
0.581mg
0.377mg
4%
Cholesterol
0mg
10mg
3%
Calcium
65mg
40mg
3%
Vitamin B2
0.346mg
0.301mg
3%
Vitamin B12
0µg
0.06µg
3%
Folate
81µg
92µg
3%
Choline
18.7mg
37.3mg
3%
Carbs
39.8g
47.06g
2%
Vitamin B6
0.073mg
0.05mg
2%
Protein per 100 calories
4.4g
1.2g
N/A
Calories per 10 g protein
227kcal
817kcal
N/A
Weight per 100 calories
42g
23g
N/A
Unsaturated / Saturated Fat ratio
4.7
1.1
N/A
Net carbs
35.3g
45.36g
N/A
Potassium
147mg
134mg
0%
Sugar
7.7g
18.15g
N/A
Vitamin A
2µg
4µg
0%
Tryptophan
0.131mg
0%
Threonine
0.299mg
0%
Isoleucine
0.399mg
0%
Leucine
0.733mg
0%
Lysine
0.297mg
0%
Methionine
0.179mg
0%
Phenylalanine
0.518mg
0%
Valine
0.461mg
0%
Histidine
0.225mg
0%
Omega-3 - DHA
0g
0.001g
N/A
Omega-3 - ALA
0.239g
N/A
Omega-3 - Eicosatrienoic acid
0.001g
N/A
Omega-6 - Gamma-linoleic acid
0.017g
N/A
Omega-6 - Eicosadienoic acid
0.006g
N/A
Omega-6 - Linoleic acid
3.573g
N/A
Macronutrient Comparison
Macronutrient breakdown side-by-side comparison
2
10%
4%
40%
44%
Protein:
10.4 g
Fats:
4.4 g
Carbs:
39.8 g
Water:
44 g
Other:
1.4 g
3
5%
25%
47%
21%
2%
Protein:
5.31 g
Fats:
24.93 g
Carbs:
47.06 g
Water:
20.82 g
Other:
1.88 g
Contains
more
Protein Protein
+95.9%
Contains
more
Water Water
+111.3%
Contains
more
Fats Fats
+466.6%
Contains
more
Carbs Carbs
+18.2%
Contains
more
Other Other
+34.3%
Fat Type Comparison
Fat type breakdown side-by-side comparison
1
18%
40%
43%
Saturated fat:
Sat. Fat
0.697 g
Monounsaturated fat:
Mono. Fat
1.59 g
Polyunsaturated fat:
Poly. Fat
1.694 g
2
47%
36%
17%
Saturated fat:
Sat. Fat
11.105 g
Monounsaturated fat:
Mono. Fat
8.544 g
Polyunsaturated fat:
Poly. Fat
3.915 g
Contains
less
Sat. Fat Saturated fat
-93.7%
Contains
more
Mono. Fat Monounsaturated fat
+437.4%
Contains
more
Poly. Fat Polyunsaturated fat
+131.1%