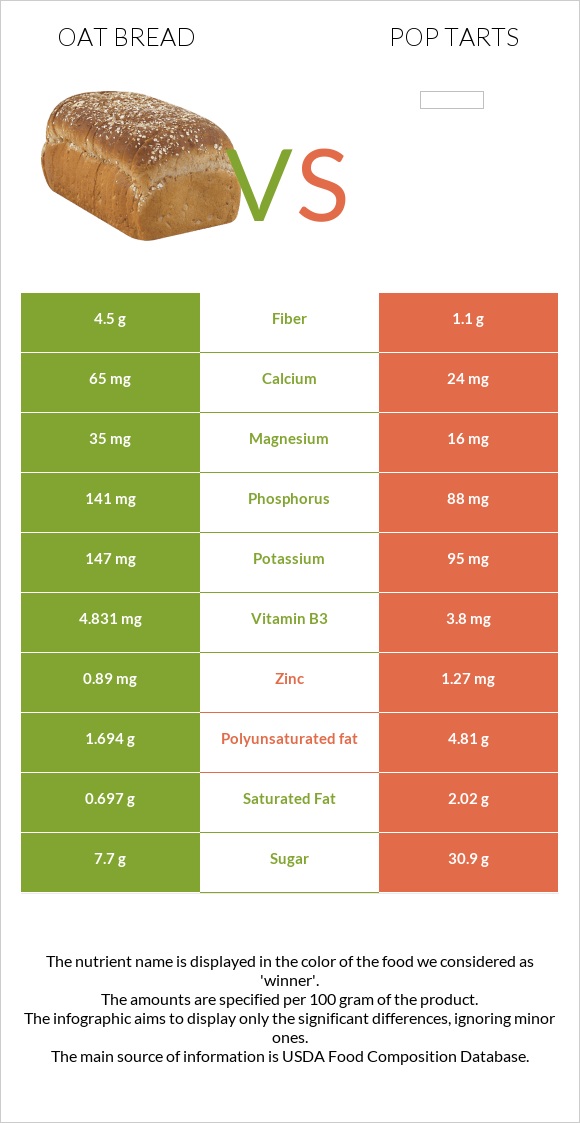
Summary of differences between oat bread and pop tarts Oat bread has more vitamin B1, fiber, vitamin B5, phosphorus, and vitamin B3; however, pop tarts are higher in vitamin B6 and vitamin A. Pop tarts cover your daily need for vitamin B6, 24% more than oat bread. Oat bread has less saturated fat. These are the specific foods used in this comparison Bread, oat bran and Toaster Pastries, KELLOGG, KELLOGG'S POP TARTS, Blueberry .
Infographic
Mineral Comparison
Mineral comparison score is based on the number of minerals by which one or the other food is richer. The "coverage" charts below show how much of the daily needs can be covered by 300 grams of the food.
7
100 g
300 g
1 oz - 28.35g 1 slice - 30g
Magnesium
Magnesium
Calcium
Calcium
Potassium
Potassium
Iron
Iron
Copper
Copper
Zinc
Zinc
Phosphorus
Phosphorus
Sodium
Sodium
Manganese
Manganese
Selenium
Selenium
25%
20%
13%
117%
45%
24%
60%
46%
102%
164%
3
100 g
300 g
1 pastry - 52g
Magnesium
Magnesium
Calcium
Calcium
Potassium
Potassium
Iron
Iron
Copper
Copper
Zinc
Zinc
Phosphorus
Phosphorus
Sodium
Sodium
Manganese
Manganese
Selenium
Selenium
11%
7.2%
8.4%
131%
50%
35%
38%
52%
0%
0%
Vitamin Comparison
Vitamin comparison score is based on the number of vitamins by which one or the other food is richer. The "coverage" charts below show how much of the daily needs can be covered by 300 grams of the food.
5
100 g
300 g
1 oz - 28.35g 1 slice - 30g
Vitamin C
Vit. C
Vitamin D
Vit. D
Vitamin A
Vit. A
Vitamin E
Vit. E
Vitamin B1
Vit. B1
Vitamin B2
Vit. B2
Vitamin B3
Vit. B3
Vitamin B5
Vit. B5
Vitamin B6
Vit. B6
Vitamin B12
Vit. B12
Vitamin K
Vit. K
Folate
Folate
0%
0%
0.67%
8.8%
126%
80%
91%
35%
17%
0%
3%
61%
2
100 g
300 g
1 pastry - 52g
Vitamin C
Vit. C
Vitamin D
Vit. D
Vitamin A
Vit. A
Vitamin E
Vit. E
Vitamin B1
Vit. B1
Vitamin B2
Vit. B2
Vitamin B3
Vit. B3
Vitamin B5
Vit. B5
Vitamin B6
Vit. B6
Vitamin B12
Vit. B12
Vitamin K
Vit. K
Folate
Folate
0%
0%
96%
0%
73%
76%
71%
0%
88%
0%
0%
60%
All nutrients comparison - raw data values
Nutrient
DV% diff.
Selenium
30µg
55%
Manganese
0.779mg
34%
Vitamin A
2µg
289µg
32%
Vitamin B6
0.073mg
0.38mg
24%
Polyunsaturated fat
1.694g
4.81g
21%
Vitamin B1
0.504mg
0.29mg
18%
Fats
4.4g
13.3g
14%
Fiber
4.5g
1.1g
14%
Protein
10.4g
4.6g
12%
Vitamin B5
0.581mg
0mg
12%
Monounsaturated fat
1.59g
6.5g
12%
Carbs
39.8g
68.41g
10%
Calories
236kcal
412kcal
9%
Phosphorus
141mg
88mg
8%
Vitamin B3
4.831mg
3.8mg
6%
Saturated fat
0.697g
2.02g
6%
Magnesium
35mg
16mg
5%
Iron
3.12mg
3.5mg
5%
Calcium
65mg
24mg
4%
Zinc
0.89mg
1.27mg
3%
Vitamin E
0.44mg
3%
Choline
18.7mg
3%
Potassium
147mg
95mg
2%
Copper
0.135mg
0.15mg
2%
Sodium
353mg
398mg
2%
Vitamin B2
0.346mg
0.33mg
1%
Vitamin K
1.2µg
1%
Protein per 100 calories
4.4g
1.1g
N/A
Calories per 10 g protein
227kcal
896kcal
N/A
Weight per 100 calories
42g
24g
N/A
Unsaturated / Saturated Fat ratio
4.7
5.6
N/A
Net carbs
35.3g
67.31g
N/A
Sugar
7.7g
30.9g
N/A
Folate
81µg
80µg
0%
Tryptophan
0.131mg
0%
Threonine
0.299mg
0%
Isoleucine
0.399mg
0%
Leucine
0.733mg
0%
Lysine
0.297mg
0%
Methionine
0.179mg
0%
Phenylalanine
0.518mg
0%
Valine
0.461mg
0%
Histidine
0.225mg
0%
Macronutrient Comparison
Macronutrient breakdown side-by-side comparison
3
10%
4%
40%
44%
Protein:
10.4 g
Fats:
4.4 g
Carbs:
39.8 g
Water:
44 g
Other:
1.4 g
2
5%
13%
68%
13%
Protein:
4.6 g
Fats:
13.3 g
Carbs:
68.41 g
Water:
12.5 g
Other:
1.19 g
Contains
more
Protein Protein
+126.1%
Contains
more
Water Water
+252%
Contains
more
Other Other
+17.6%
Contains
more
Fats Fats
+202.3%
Contains
more
Carbs Carbs
+71.9%
Fat Type Comparison
Fat type breakdown side-by-side comparison
1
18%
40%
43%
Saturated fat:
Sat. Fat
0.697 g
Monounsaturated fat:
Mono. Fat
1.59 g
Polyunsaturated fat:
Poly. Fat
1.694 g
2
15%
49%
36%
Saturated fat:
Sat. Fat
2.02 g
Monounsaturated fat:
Mono. Fat
6.5 g
Polyunsaturated fat:
Poly. Fat
4.81 g
Contains
less
Sat. Fat Saturated fat
-65.5%
Contains
more
Mono. Fat Monounsaturated fat
+308.8%
Contains
more
Poly. Fat Polyunsaturated fat
+183.9%