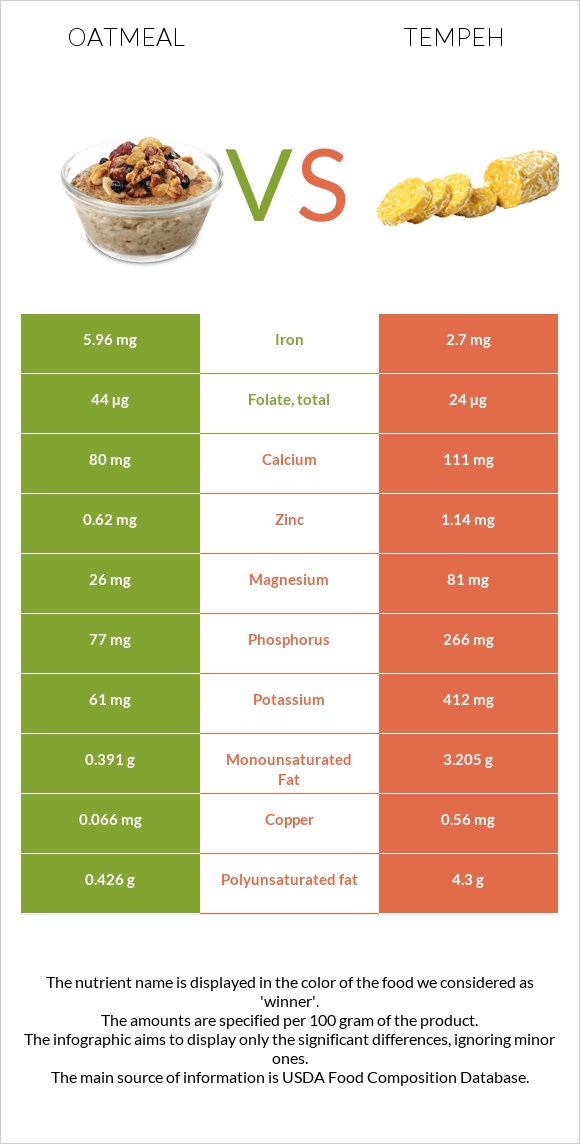
What are the differences between oatmeal and tempeh? Oatmeal is higher in iron, vitamin B1, and selenium, yet tempeh is higher in copper, manganese, phosphorus, magnesium, vitamin B2, and potassium. Tempeh's daily need coverage for copper is 55% more. The amount of saturated fat in oatmeal is lower. The glycemic index of tempeh is lower. We used Cereals, oats, instant, fortified, plain, prepared with water (boiling water added or microwaved) and Tempeh types in this article.
Infographic
Mineral Comparison
Mineral comparison score is based on the number of minerals by which one or the other food is richer. The "coverage" charts below show how much of the daily needs can be covered by 300 grams of the food.
2
100 g
300 g
1 oz, dry, yields - 177g 1 packet, dry, yields - 177g 1 cup, cooked - 234g 1 cup, dry, yields - 501g
Magnesium
Magnesium
Calcium
Calcium
Potassium
Potassium
Iron
Iron
Copper
Copper
Zinc
Zinc
Phosphorus
Phosphorus
Sodium
Sodium
Manganese
Manganese
Selenium
Selenium
19%
24%
5.4%
224%
22%
17%
33%
6.4%
73%
27%
8
100 g
300 g
1 cup - 166g
Magnesium
Magnesium
Calcium
Calcium
Potassium
Potassium
Iron
Iron
Copper
Copper
Zinc
Zinc
Phosphorus
Phosphorus
Sodium
Sodium
Manganese
Manganese
Selenium
Selenium
58%
33%
36%
101%
187%
31%
114%
1.2%
170%
0%
Vitamin Comparison
Vitamin comparison score is based on the number of vitamins by which one or the other food is richer. The "coverage" charts below show how much of the daily needs can be covered by 300 grams of the food.
8
100 g
300 g
1 oz, dry, yields - 177g 1 packet, dry, yields - 177g 1 cup, cooked - 234g 1 cup, dry, yields - 501g
Vitamin C
Vit. C
Vitamin D
Vit. D
Vitamin A
Vit. A
Vitamin E
Vit. E
Vitamin B1
Vit. B1
Vitamin B2
Vit. B2
Vitamin B3
Vit. B3
Vitamin B5
Vit. B5
Vitamin B6
Vit. B6
Vitamin B12
Vit. B12
Vitamin K
Vit. K
Folate
Folate
0%
0%
43%
1.4%
65%
50%
57%
19%
67%
0%
1%
33%
2
100 g
300 g
1 cup - 166g
Vitamin C
Vit. C
Vitamin D
Vit. D
Vitamin A
Vit. A
Vitamin E
Vit. E
Vitamin B1
Vit. B1
Vitamin B2
Vit. B2
Vitamin B3
Vit. B3
Vitamin B5
Vit. B5
Vitamin B6
Vit. B6
Vitamin B12
Vit. B12
Vitamin K
Vit. K
Folate
Folate
0%
0%
0%
0%
20%
83%
50%
17%
50%
10%
0%
18%
All nutrients comparison - raw data values
Nutrient
DV% diff.
Copper
0.066mg
0.56mg
55%
Iron
5.96mg
2.7mg
41%
Protein
2.37g
20.29g
36%
Manganese
0.558mg
1.3mg
32%
Phosphorus
77mg
266mg
27%
Polyunsaturated fat
0.426g
4.3g
26%
Fats
1.36g
10.8g
15%
Vitamin B1
0.26mg
0.078mg
15%
Vitamin A
130µg
0µg
14%
Magnesium
26mg
81mg
13%
Vitamin B2
0.215mg
0.358mg
11%
Saturated fat
0.226g
2.539g
11%
Potassium
61mg
412mg
10%
Selenium
5µg
0µg
9%
Fiber
1.7g
7%
Monounsaturated fat
0.391g
3.205g
7%
Calories
68kcal
192kcal
6%
Vitamin B6
0.29mg
0.215mg
6%
Zinc
0.62mg
1.14mg
5%
Folate
44µg
24µg
5%
Starch
10.37g
4%
Calcium
80mg
111mg
3%
Vitamin B12
0µg
0.08µg
3%
Sodium
49mg
9mg
2%
Vitamin B3
3.025mg
2.64mg
2%
Carbs
11.67g
7.64g
1%
Vitamin B5
0.317mg
0.278mg
1%
Choline
4.7mg
1%
Protein per 100 calories
3.5g
11g
N/A
Calories per 10 g protein
287kcal
95kcal
N/A
Weight per 100 calories
147g
52g
N/A
Unsaturated / Saturated Fat ratio
3.6
3
N/A
Net carbs
9.97g
7.64g
N/A
Sugar
0.46g
N/A
Vitamin E
0.07mg
0%
Vitamin K
0.4µg
0%
Trans fat
0.003g
0g
N/A
Tryptophan
0.04mg
0.194mg
0%
Threonine
0.083mg
0.796mg
0%
Isoleucine
0.105mg
0.88mg
0%
Leucine
0.2mg
1.43mg
0%
Lysine
0.135mg
0.908mg
0%
Methionine
0.04mg
0.175mg
0%
Phenylalanine
0.13mg
0.893mg
0%
Valine
0.151mg
0.92mg
0%
Histidine
0.057mg
0.466mg
0%
Macronutrient Comparison
Macronutrient breakdown side-by-side comparison
2
2%
12%
84%
Protein:
2.37 g
Fats:
1.36 g
Carbs:
11.67 g
Water:
84.03 g
Other:
0.57 g
3
20%
11%
8%
60%
Protein:
20.29 g
Fats:
10.8 g
Carbs:
7.64 g
Water:
59.65 g
Other:
1.62 g
Contains
more
Carbs Carbs
+52.7%
Contains
more
Water Water
+40.9%
Contains
more
Protein Protein
+756.1%
Contains
more
Fats Fats
+694.1%
Contains
more
Other Other
+184.2%
Fat Type Comparison
Fat type breakdown side-by-side comparison
1
22%
37%
41%
Saturated fat:
Sat. Fat
0.226 g
Monounsaturated fat:
Mono. Fat
0.391 g
Polyunsaturated fat:
Poly. Fat
0.426 g
2
25%
32%
43%
Saturated fat:
Sat. Fat
2.539 g
Monounsaturated fat:
Mono. Fat
3.205 g
Polyunsaturated fat:
Poly. Fat
4.3 g
Contains
less
Sat. Fat Saturated fat
-91.1%
Contains
more
Mono. Fat Monounsaturated fat
+719.7%
Contains
more
Poly. Fat Polyunsaturated fat
+909.4%