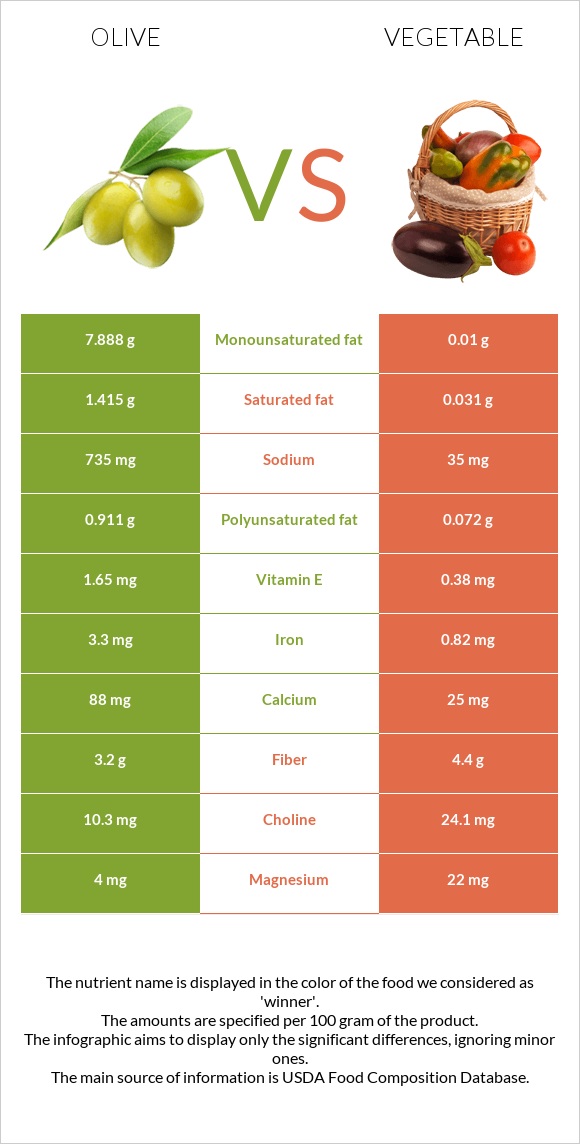
What are the differences between olive and vegetable? Olive is higher in iron, copper, and vitamin E, yet vegetable is higher in vitamin A, vitamin K, manganese, vitamin B2, and phosphorus. Vegetable's daily need coverage for vitamin A is 77% more. Olive has 46 times more saturated fat than vegetable. While olive has 1.415g of saturated fat, vegetable has only 0.031g. We used Olives, ripe, canned (small-extra large) and Vegetables, mixed, frozen, cooked, boiled, drained, without salt types in this article.
Infographic
Mineral Comparison
Mineral comparison score is based on the number of minerals by which one or the other food is richer. The "coverage" charts below show how much of the daily needs can be covered by 300 grams of the food.
4
100 g
300 g
1 small - 3.2g 1 large - 4.4g 1 tbsp - 8.4g
Magnesium
Magnesium
Calcium
Calcium
Potassium
Potassium
Iron
Iron
Copper
Copper
Zinc
Zinc
Phosphorus
Phosphorus
Sodium
Sodium
Manganese
Manganese
Selenium
Selenium
2.9%
26%
0.71%
124%
84%
6%
1.3%
96%
2.6%
4.9%
6
100 g
300 g
0.5 cup - 91g 1 package (10 oz) yields - 275g
Magnesium
Magnesium
Calcium
Calcium
Potassium
Potassium
Iron
Iron
Copper
Copper
Zinc
Zinc
Phosphorus
Phosphorus
Sodium
Sodium
Manganese
Manganese
Selenium
Selenium
16%
7.5%
15%
31%
28%
13%
22%
4.6%
49%
1.6%
Vitamin Comparison
Vitamin comparison score is based on the number of vitamins by which one or the other food is richer. The "coverage" charts below show how much of the daily needs can be covered by 300 grams of the food.
1
100 g
300 g
1 small - 3.2g 1 large - 4.4g 1 tbsp - 8.4g
Vitamin C
Vit. C
Vitamin D
Vit. D
Vitamin A
Vit. A
Vitamin E
Vit. E
Vitamin B1
Vit. B1
Vitamin B2
Vit. B2
Vitamin B3
Vit. B3
Vitamin B5
Vit. B5
Vitamin B6
Vit. B6
Vitamin B12
Vit. B12
Vitamin K
Vit. K
Folate
Folate
3%
0%
6.7%
33%
0.75%
0%
0.69%
0.9%
2.1%
0%
3.5%
0%
9
100 g
300 g
0.5 cup - 91g 1 package (10 oz) yields - 275g
Vitamin C
Vit. C
Vitamin D
Vit. D
Vitamin A
Vit. A
Vitamin E
Vit. E
Vitamin B1
Vit. B1
Vitamin B2
Vit. B2
Vitamin B3
Vit. B3
Vitamin B5
Vit. B5
Vitamin B6
Vit. B6
Vitamin B12
Vit. B12
Vitamin K
Vit. K
Folate
Folate
11%
0%
71%
7.6%
18%
28%
16%
9.1%
17%
0%
59%
14%
All nutrients comparison - raw data values
Nutrient
DV% diff.
Iron
3.3mg
0.82mg
31%
Sodium
735mg
35mg
30%
Vitamin A
20µg
214µg
22%
Monounsaturated fat
7.888g
0.01g
20%
Copper
0.251mg
0.083mg
19%
Vitamin K
1.4µg
23.5µg
18%
Fats
10.68g
0.15g
16%
Manganese
0.02mg
0.379mg
16%
Vitamin B2
0mg
0.12mg
9%
Vitamin E
1.65mg
0.38mg
8%
Phosphorus
3mg
51mg
7%
Calcium
88mg
25mg
6%
Vitamin B1
0.003mg
0.071mg
6%
Saturated fat
1.415g
0.031g
6%
Polyunsaturated fat
0.911g
0.072g
6%
Potassium
8mg
169mg
5%
Fiber
3.2g
4.4g
5%
Vitamin B3
0.037mg
0.851mg
5%
Vitamin B6
0.009mg
0.074mg
5%
Folate
0µg
19µg
5%
Protein
0.84g
2.86g
4%
Magnesium
4mg
22mg
4%
Calories
115kcal
65kcal
3%
Vitamin C
0.9mg
3.2mg
3%
Vitamin B5
0.015mg
0.151mg
3%
Choline
10.3mg
24.1mg
3%
Carbs
6.26g
13.09g
2%
Zinc
0.22mg
0.49mg
2%
Selenium
0.9µg
0.3µg
1%
Protein per 100 calories
0.73g
4.4g
N/A
Calories per 10 g protein
1369kcal
227kcal
N/A
Weight per 100 calories
87g
154g
N/A
Unsaturated / Saturated Fat ratio
6.2
2.6
N/A
Net carbs
3.06g
8.69g
N/A
Sugar
0g
3.12g
N/A
Tryptophan
0.029mg
0%
Threonine
0.026mg
0.115mg
0%
Isoleucine
0.031mg
0.139mg
0%
Leucine
0.05mg
0.19mg
0%
Lysine
0.032mg
0.17mg
0%
Methionine
0.012mg
0.034mg
0%
Phenylalanine
0.029mg
0.12mg
0%
Valine
0.038mg
0.149mg
0%
Histidine
0.023mg
0.073mg
0%
Macronutrient Comparison
Macronutrient breakdown side-by-side comparison
2
11%
6%
80%
2%
Protein:
0.84 g
Fats:
10.68 g
Carbs:
6.26 g
Water:
79.99 g
Other:
2.23 g
3
3%
13%
83%
Protein:
2.86 g
Fats:
0.15 g
Carbs:
13.09 g
Water:
83.23 g
Other:
0.67 g
Contains
more
Fats Fats
+7020%
Contains
more
Other Other
+232.8%
Contains
more
Protein Protein
+240.5%
Contains
more
Carbs Carbs
+109.1%
Fat Type Comparison
Fat type breakdown side-by-side comparison
2
14%
77%
9%
Saturated fat:
Sat. Fat
1.415 g
Monounsaturated fat:
Mono. Fat
7.888 g
Polyunsaturated fat:
Poly. Fat
0.911 g
1
27%
9%
64%
Saturated fat:
Sat. Fat
0.031 g
Monounsaturated fat:
Mono. Fat
0.01 g
Polyunsaturated fat:
Poly. Fat
0.072 g
Contains
more
Mono. Fat Monounsaturated fat
+78780%
Contains
more
Poly. Fat Polyunsaturated fat
+1165.3%
Contains
less
Sat. Fat Saturated fat
-97.8%