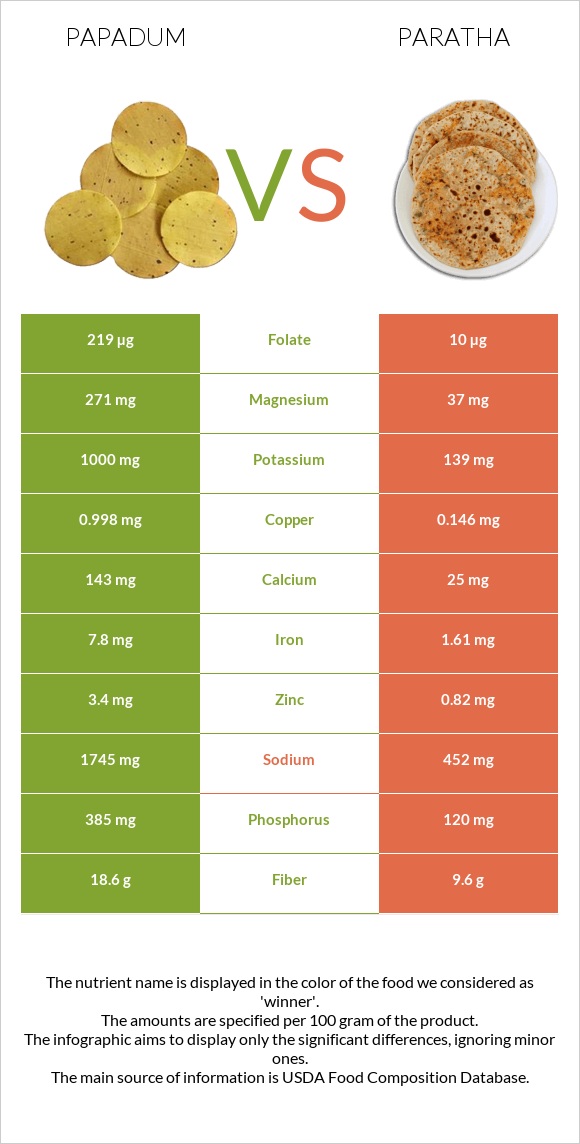
What are the main differences between papadum and paratha? Paratha has less copper, iron, magnesium, folate, phosphorus, fiber, potassium, and zinc than papadum. Papadum's daily need coverage for copper is 95% higher. Papadum has 22 times more folate than paratha. Papadum has 219µg of folate, while paratha has 10µg. Paratha contains less sodium. We used Papad and Bread, paratha, whole wheat, commercially prepared, frozen types in this comparison.
Infographic
Mineral Comparison
Mineral comparison score is based on the number of minerals by which one or the other food is richer. The "coverage" charts below show how much of the daily needs can be covered by 300 grams of the food.
9
100 g
300 g
Magnesium
Magnesium
Calcium
Calcium
Potassium
Potassium
Iron
Iron
Copper
Copper
Zinc
Zinc
Phosphorus
Phosphorus
Sodium
Sodium
Manganese
Manganese
Selenium
Selenium
194%
43%
88%
293%
333%
93%
165%
228%
204%
45%
1
100 g
300 g
1 piece - 79g
Magnesium
Magnesium
Calcium
Calcium
Potassium
Potassium
Iron
Iron
Copper
Copper
Zinc
Zinc
Phosphorus
Phosphorus
Sodium
Sodium
Manganese
Manganese
Selenium
Selenium
26%
7.5%
12%
60%
49%
22%
51%
59%
137%
39%
Vitamin Comparison
Vitamin comparison score is based on the number of vitamins by which one or the other food is richer. The "coverage" charts below show how much of the daily needs can be covered by 300 grams of the food.
6
100 g
300 g
Vitamin C
Vit. C
Vitamin D
Vit. D
Vitamin A
Vit. A
Vitamin E
Vit. E
Vitamin B1
Vit. B1
Vitamin B2
Vit. B2
Vitamin B3
Vit. B3
Vitamin B5
Vit. B5
Vitamin B6
Vit. B6
Vitamin B12
Vit. B12
Vitamin K
Vit. K
Folate
Folate
0%
0%
4.3%
1%
69%
60%
28%
55%
66%
0%
1%
164%
3
100 g
300 g
1 piece - 79g
Vitamin C
Vit. C
Vitamin D
Vit. D
Vitamin A
Vit. A
Vitamin E
Vit. E
Vitamin B1
Vit. B1
Vitamin B2
Vit. B2
Vitamin B3
Vit. B3
Vitamin B5
Vit. B5
Vitamin B6
Vit. B6
Vitamin B12
Vit. B12
Vitamin K
Vit. K
Folate
Folate
0%
0%
0.67%
27%
28%
18%
34%
28%
18%
0%
8.5%
7.5%
All nutrients comparison - raw data values
Nutrient
DV% diff.
Copper
0.998mg
0.146mg
95%
Iron
7.8mg
1.61mg
77%
Magnesium
271mg
37mg
56%
Sodium
1745mg
452mg
56%
Folate
219µg
10µg
52%
Protein
25.56g
6.36g
38%
Phosphorus
385mg
120mg
38%
Fiber
18.6g
9.6g
36%
Potassium
1000mg
139mg
25%
Zinc
3.4mg
0.82mg
23%
Manganese
1.562mg
1.054mg
22%
Saturated fat
1.084g
5.826g
22%
Vitamin B6
0.285mg
0.08mg
16%
Fats
3.25g
13.2g
15%
Vitamin B1
0.277mg
0.11mg
14%
Vitamin B2
0.258mg
0.076mg
14%
Starch
31.5g
13%
Calcium
143mg
25mg
12%
Vitamin E
0.05mg
1.35mg
9%
Vitamin B5
0.917mg
0.465mg
9%
Polyunsaturated fat
1.148g
2.484g
9%
Monounsaturated fat
0.532g
3.837g
8%
Carbs
59.87g
45.35g
5%
Vitamin K
0.4µg
3.4µg
3%
Calories
371kcal
326kcal
2%
Selenium
8.3µg
7.1µg
2%
Vitamin B3
1.472mg
1.83mg
2%
Cholesterol
4mg
1mg
1%
Vitamin A
13µg
2µg
1%
Choline
0.4mg
6.3mg
1%
Protein per 100 calories
6.9g
2g
N/A
Calories per 10 g protein
145kcal
513kcal
N/A
Weight per 100 calories
27g
31g
N/A
Unsaturated / Saturated Fat ratio
1.5
1.1
N/A
Net carbs
41.27g
35.75g
N/A
Sugar
0g
4.15g
N/A
Trans fat
0.034g
N/A
Tryptophan
0.266mg
0%
Threonine
0.886mg
0%
Isoleucine
1.303mg
0%
Leucine
2.115mg
0%
Lysine
1.695mg
0%
Methionine
0.372mg
0%
Phenylalanine
1.491mg
0%
Valine
1.434mg
0%
Histidine
0.715mg
0%
Fructose
0.35g
0%
Omega-3 - ALA
0.064g
N/A
Omega-3 - Eicosatrienoic acid
0.003g
N/A
Omega-6 - Gamma-linoleic acid
0.006g
N/A
Omega-6 - Eicosadienoic acid
0.002g
N/A
Omega-6 - Linoleic acid
2.386g
N/A
Macronutrient Comparison
Macronutrient breakdown side-by-side comparison
3
26%
3%
60%
3%
8%
Protein:
25.56 g
Fats:
3.25 g
Carbs:
59.87 g
Water:
3.49 g
Other:
7.83 g
2
6%
13%
45%
34%
Protein:
6.36 g
Fats:
13.2 g
Carbs:
45.35 g
Water:
33.5 g
Other:
1.59 g
Contains
more
Protein Protein
+301.9%
Contains
more
Carbs Carbs
+32%
Contains
more
Other Other
+392.5%
Contains
more
Fats Fats
+306.2%
Contains
more
Water Water
+859.9%
Fat Type Comparison
Fat type breakdown side-by-side comparison
1
39%
19%
42%
Saturated fat:
Sat. Fat
1.084 g
Monounsaturated fat:
Mono. Fat
0.532 g
Polyunsaturated fat:
Poly. Fat
1.148 g
2
48%
32%
20%
Saturated fat:
Sat. Fat
5.826 g
Monounsaturated fat:
Mono. Fat
3.837 g
Polyunsaturated fat:
Poly. Fat
2.484 g
Contains
less
Sat. Fat Saturated fat
-81.4%
Contains
more
Mono. Fat Monounsaturated fat
+621.2%
Contains
more
Poly. Fat Polyunsaturated fat
+116.4%