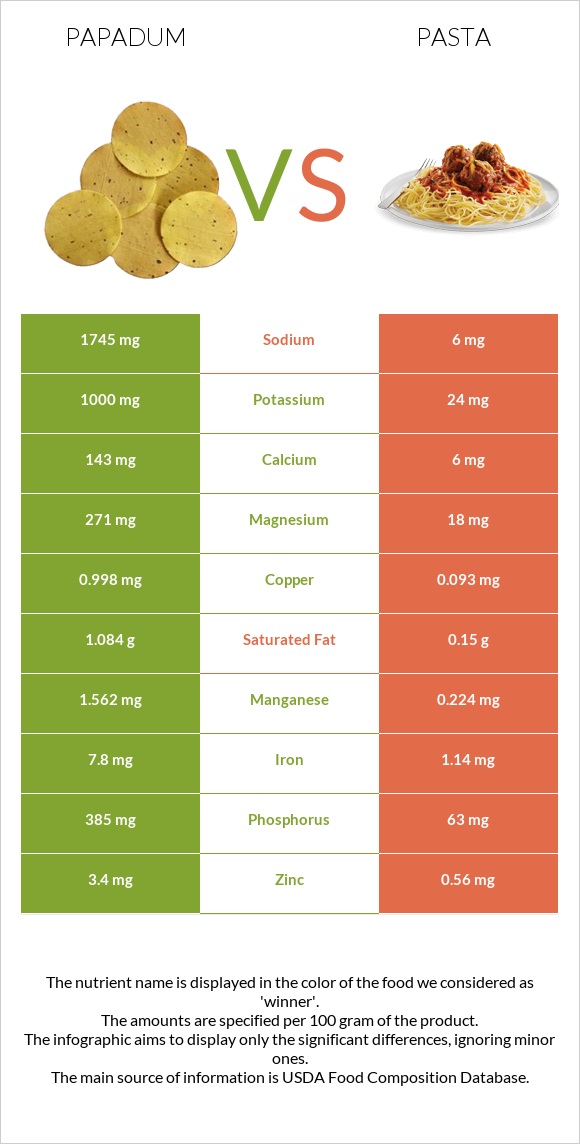
The main differences between papadum and pasta Pasta contains less copper, iron, magnesium, manganese, phosphorus, folate, potassium, zinc, and vitamin B6 than papadum. Daily need coverage for copper for papadum is 101% higher. Pasta has 291 times less sodium than papadum. Papadum has 1745mg of sodium, while pasta has 6mg. Food types used in this article are Papad and Pasta, fresh-refrigerated, plain, cooked .
Infographic
Mineral Comparison
Mineral comparison score is based on the number of minerals by which one or the other food is richer. The "coverage" charts below show how much of the daily needs can be covered by 300 grams of the food.
9
100 g
300 g
Magnesium
Magnesium
Calcium
Calcium
Potassium
Potassium
Iron
Iron
Copper
Copper
Zinc
Zinc
Phosphorus
Phosphorus
Sodium
Sodium
Manganese
Manganese
Selenium
Selenium
194%
43%
88%
293%
333%
93%
165%
228%
204%
45%
1
100 g
300 g
2 oz - 128g
Magnesium
Magnesium
Calcium
Calcium
Potassium
Potassium
Iron
Iron
Copper
Copper
Zinc
Zinc
Phosphorus
Phosphorus
Sodium
Sodium
Manganese
Manganese
Selenium
Selenium
13%
1.8%
2.1%
43%
31%
15%
27%
0.78%
29%
0%
Vitamin Comparison
Vitamin comparison score is based on the number of vitamins by which one or the other food is richer. The "coverage" charts below show how much of the daily needs can be covered by 300 grams of the food.
9
100 g
300 g
Vitamin C
Vit. C
Vitamin D
Vit. D
Vitamin A
Vit. A
Vitamin E
Vit. E
Vitamin B1
Vit. B1
Vitamin B2
Vit. B2
Vitamin B3
Vit. B3
Vitamin B5
Vit. B5
Vitamin B6
Vit. B6
Vitamin B12
Vit. B12
Vitamin K
Vit. K
Folate
Folate
0%
0%
4.3%
1%
69%
60%
28%
55%
66%
0%
1%
164%
1
100 g
300 g
2 oz - 128g
Vitamin C
Vit. C
Vitamin D
Vit. D
Vitamin A
Vit. A
Vitamin E
Vit. E
Vitamin B1
Vit. B1
Vitamin B2
Vit. B2
Vitamin B3
Vit. B3
Vitamin B5
Vit. B5
Vitamin B6
Vit. B6
Vitamin B12
Vit. B12
Vitamin K
Vit. K
Folate
Folate
0%
0%
2%
0%
52%
35%
19%
11%
7.8%
18%
0%
48%
All nutrients comparison - raw data values
Nutrient
DV% diff.
Copper
0.998mg
0.093mg
101%
Iron
7.8mg
1.14mg
83%
Sodium
1745mg
6mg
76%
Fiber
18.6g
74%
Magnesium
271mg
18mg
60%
Manganese
1.562mg
0.224mg
58%
Phosphorus
385mg
63mg
46%
Protein
25.56g
5.15g
41%
Folate
219µg
64µg
39%
Potassium
1000mg
24mg
29%
Zinc
3.4mg
0.56mg
26%
Vitamin B6
0.285mg
0.034mg
19%
Selenium
8.3µg
15%
Vitamin B5
0.917mg
0.183mg
15%
Calcium
143mg
6mg
14%
Calories
371kcal
131kcal
12%
Carbs
59.87g
24.93g
12%
Cholesterol
4mg
33mg
10%
Vitamin B2
0.258mg
0.15mg
8%
Vitamin B1
0.277mg
0.209mg
6%
Vitamin B12
0µg
0.14µg
6%
Polyunsaturated fat
1.148g
0.429g
5%
Saturated fat
1.084g
0.15g
4%
Fats
3.25g
1.05g
3%
Vitamin B3
1.472mg
0.992mg
3%
Vitamin A
13µg
6µg
1%
Monounsaturated fat
0.532g
0.124g
1%
Protein per 100 calories
6.9g
3.9g
N/A
Calories per 10 g protein
145kcal
254kcal
N/A
Weight per 100 calories
27g
76g
N/A
Unsaturated / Saturated Fat ratio
1.5
3.7
N/A
Net carbs
41.27g
24.93g
N/A
Vitamin E
0.05mg
0%
Vitamin K
0.4µg
0%
Choline
0.4mg
0%
Tryptophan
0.266mg
0.065mg
0%
Threonine
0.886mg
0.134mg
0%
Isoleucine
1.303mg
0.197mg
0%
Leucine
2.115mg
0.348mg
0%
Lysine
1.695mg
0.097mg
0%
Methionine
0.372mg
0.079mg
0%
Phenylalanine
1.491mg
0.247mg
0%
Valine
1.434mg
0.217mg
0%
Histidine
0.715mg
0.103mg
0%
Macronutrient Comparison
Macronutrient breakdown side-by-side comparison
4
26%
3%
60%
3%
8%
Protein:
25.56 g
Fats:
3.25 g
Carbs:
59.87 g
Water:
3.49 g
Other:
7.83 g
1
5%
25%
69%
Protein:
5.15 g
Fats:
1.05 g
Carbs:
24.93 g
Water:
68.56 g
Other:
0.31 g
Contains
more
Protein Protein
+396.3%
Contains
more
Fats Fats
+209.5%
Contains
more
Carbs Carbs
+140.2%
Contains
more
Other Other
+2425.8%
Contains
more
Water Water
+1864.5%
Fat Type Comparison
Fat type breakdown side-by-side comparison
2
39%
19%
42%
Saturated fat:
Sat. Fat
1.084 g
Monounsaturated fat:
Mono. Fat
0.532 g
Polyunsaturated fat:
Poly. Fat
1.148 g
1
21%
18%
61%
Saturated fat:
Sat. Fat
0.15 g
Monounsaturated fat:
Mono. Fat
0.124 g
Polyunsaturated fat:
Poly. Fat
0.429 g
Contains
more
Mono. Fat Monounsaturated fat
+329%
Contains
more
Poly. Fat Polyunsaturated fat
+167.6%
Contains
less
Sat. Fat Saturated fat
-86.2%