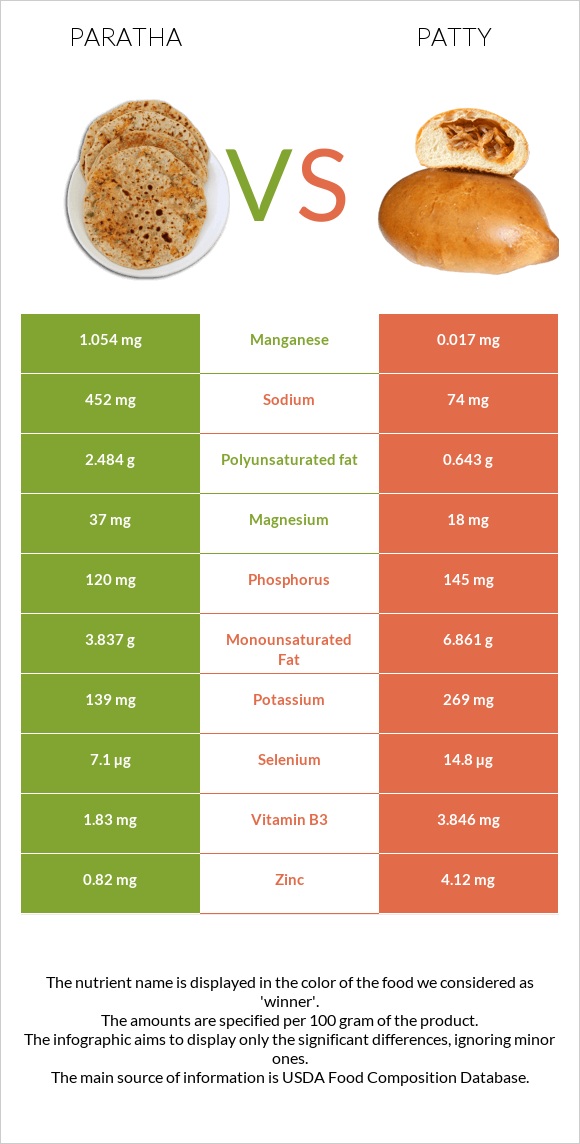
Summary of differences between paratha and patty Paratha has more manganese, fiber, and copper; however, patty is higher in vitamin B12, zinc, selenium, vitamin B3, and vitamin B6. Patty covers your daily need for vitamin B12, 85% more than paratha. Patty has less sodium. The glycemic index of paratha is higher. These are the specific foods used in this comparison Bread, paratha, whole wheat, commercially prepared, frozen and USDA Commodity, beef, patties (100%), frozen, raw .
Infographic
Mineral Comparison
Mineral comparison score is based on the number of minerals by which one or the other food is richer. The "coverage" charts below show how much of the daily needs can be covered by 300 grams of the food.
4
100 g
300 g
1 piece - 79g
Magnesium
Magnesium
Calcium
Calcium
Potassium
Potassium
Iron
Iron
Copper
Copper
Zinc
Zinc
Phosphorus
Phosphorus
Sodium
Sodium
Manganese
Manganese
Selenium
Selenium
26%
7.5%
12%
60%
49%
22%
51%
59%
137%
39%
6
100 g
300 g
3 oz - 85g
Magnesium
Magnesium
Calcium
Calcium
Potassium
Potassium
Iron
Iron
Copper
Copper
Zinc
Zinc
Phosphorus
Phosphorus
Sodium
Sodium
Manganese
Manganese
Selenium
Selenium
13%
2.1%
24%
72%
24%
112%
62%
9.7%
2.2%
81%
Vitamin Comparison
Vitamin comparison score is based on the number of vitamins by which one or the other food is richer. The "coverage" charts below show how much of the daily needs can be covered by 300 grams of the food.
6
100 g
300 g
1 piece - 79g
Vitamin C
Vit. C
Vitamin D
Vit. D
Vitamin A
Vit. A
Vitamin E
Vit. E
Vitamin B1
Vit. B1
Vitamin B2
Vit. B2
Vitamin B3
Vit. B3
Vitamin B5
Vit. B5
Vitamin B6
Vit. B6
Vitamin B12
Vit. B12
Vitamin K
Vit. K
Folate
Folate
0%
0%
0.67%
27%
28%
18%
34%
28%
18%
0%
8.5%
7.5%
4
100 g
300 g
3 oz - 85g
Vitamin C
Vit. C
Vitamin D
Vit. D
Vitamin A
Vit. A
Vitamin E
Vit. E
Vitamin B1
Vit. B1
Vitamin B2
Vit. B2
Vitamin B3
Vit. B3
Vitamin B5
Vit. B5
Vitamin B6
Vit. B6
Vitamin B12
Vit. B12
Vitamin K
Vit. K
Folate
Folate
0%
0%
0%
0%
11%
37%
72%
19%
49%
256%
0%
4.5%
All nutrients comparison - raw data values
Nutrient
DV% diff.
Vitamin B12
0µg
2.05µg
85%
Manganese
1.054mg
0.017mg
45%
Fiber
9.6g
0g
38%
Zinc
0.82mg
4.12mg
30%
Protein
6.36g
14.63g
17%
Cholesterol
1mg
53mg
17%
Sodium
452mg
74mg
16%
Carbs
45.35g
0g
15%
Selenium
7.1µg
14.8µg
14%
Starch
31.5g
13%
Vitamin B3
1.83mg
3.846mg
13%
Polyunsaturated fat
2.484g
0.643g
12%
Vitamin B6
0.08mg
0.214mg
10%
Vitamin E
1.35mg
9%
Copper
0.146mg
0.073mg
8%
Monounsaturated fat
3.837g
6.861g
8%
Calories
326kcal
204kcal
6%
Vitamin B1
0.11mg
0.043mg
6%
Vitamin B2
0.076mg
0.16mg
6%
Magnesium
37mg
18mg
5%
Fats
13.2g
15.69g
4%
Potassium
139mg
269mg
4%
Iron
1.61mg
1.93mg
4%
Phosphorus
120mg
145mg
4%
Vitamin B5
0.465mg
0.309mg
3%
Vitamin K
3.4µg
3%
Calcium
25mg
7mg
2%
Saturated fat
5.826g
6.333g
2%
Folate
10µg
6µg
1%
Choline
6.3mg
1%
Protein per 100 calories
2g
7.2g
N/A
Calories per 10 g protein
513kcal
139kcal
N/A
Weight per 100 calories
31g
49g
N/A
Unsaturated / Saturated Fat ratio
1.1
1.2
N/A
Net carbs
35.75g
0g
N/A
Sugar
4.15g
N/A
Vitamin A
2µg
0µg
0%
Trans fat
0.034g
N/A
Fructose
0.35g
0%
Omega-3 - ALA
0.064g
N/A
Omega-3 - Eicosatrienoic acid
0.003g
N/A
Omega-6 - Gamma-linoleic acid
0.006g
N/A
Omega-6 - Eicosadienoic acid
0.002g
N/A
Omega-6 - Linoleic acid
2.386g
N/A
Macronutrient Comparison
Macronutrient breakdown side-by-side comparison
1
6%
13%
45%
34%
Protein:
6.36 g
Fats:
13.2 g
Carbs:
45.35 g
Water:
33.5 g
Other:
1.59 g
4
15%
16%
65%
5%
Protein:
14.63 g
Fats:
15.69 g
Carbs:
0 g
Water:
64.72 g
Other:
4.96 g
Contains
more
Carbs Carbs
+∞%
Contains
more
Protein Protein
+130%
Contains
more
Fats Fats
+18.9%
Contains
more
Water Water
+93.2%
Contains
more
Other Other
+211.9%
Fat Type Comparison
Fat type breakdown side-by-side comparison
2
48%
32%
20%
Saturated fat:
Sat. Fat
5.826 g
Monounsaturated fat:
Mono. Fat
3.837 g
Polyunsaturated fat:
Poly. Fat
2.484 g
1
46%
50%
5%
Saturated fat:
Sat. Fat
6.333 g
Monounsaturated fat:
Mono. Fat
6.861 g
Polyunsaturated fat:
Poly. Fat
0.643 g
Contains
more
Poly. Fat Polyunsaturated fat
+286.3%
Contains
more
Mono. Fat Monounsaturated fat
+78.8%
~equal in
Saturated fat
~6.333g