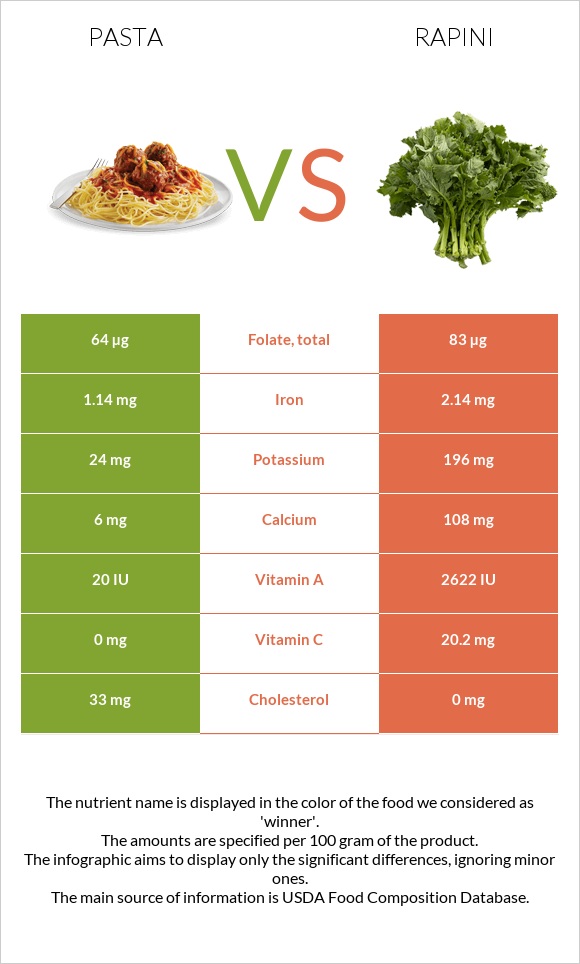
Significant differences between pasta and rapini Pasta has more vitamin B12 and copper; however, rapini is richer in vitamin A, vitamin C, iron, vitamin B6, calcium, manganese, and potassium. Rapini covers your daily vitamin A needs 52% more than pasta. Pasta has a higher glycemic index. The glycemic index of pasta is 49, while the glycemic index of rapini is 32. Specific food types used in this comparison are Pasta, fresh-refrigerated, plain, cooked and Broccoli raab, raw .
Infographic
Mineral Comparison
Mineral comparison score is based on the number of minerals by which one or the other food is richer. The "coverage" charts below show how much of the daily needs can be covered by 300 grams of the food.
2
100 g
300 g
2 oz - 128g
Magnesium
Magnesium
Calcium
Calcium
Potassium
Potassium
Iron
Iron
Copper
Copper
Zinc
Zinc
Phosphorus
Phosphorus
Sodium
Sodium
Manganese
Manganese
Selenium
Selenium
13%
1.8%
2.1%
43%
31%
15%
27%
0.78%
29%
0%
8
100 g
300 g
1 stalk - 19g 1 cup chopped - 40g
Magnesium
Magnesium
Calcium
Calcium
Potassium
Potassium
Iron
Iron
Copper
Copper
Zinc
Zinc
Phosphorus
Phosphorus
Sodium
Sodium
Manganese
Manganese
Selenium
Selenium
16%
32%
17%
80%
14%
21%
31%
4.3%
52%
5.5%
Vitamin Comparison
Vitamin comparison score is based on the number of vitamins by which one or the other food is richer. The "coverage" charts below show how much of the daily needs can be covered by 300 grams of the food.
3
100 g
300 g
2 oz - 128g
Vitamin C
Vit. C
Vitamin D
Vit. D
Vitamin A
Vit. A
Vitamin E
Vit. E
Vitamin B1
Vit. B1
Vitamin B2
Vit. B2
Vitamin B3
Vit. B3
Vitamin B5
Vit. B5
Vitamin B6
Vit. B6
Vitamin B12
Vit. B12
Vitamin K
Vit. K
Folate
Folate
0%
0%
2%
0%
52%
35%
19%
11%
7.8%
18%
0%
48%
8
100 g
300 g
1 stalk - 19g 1 cup chopped - 40g
Vitamin C
Vit. C
Vitamin D
Vit. D
Vitamin A
Vit. A
Vitamin E
Vit. E
Vitamin B1
Vit. B1
Vitamin B2
Vit. B2
Vitamin B3
Vit. B3
Vitamin B5
Vit. B5
Vitamin B6
Vit. B6
Vitamin B12
Vit. B12
Vitamin K
Vit. K
Folate
Folate
67%
0%
44%
32%
41%
30%
23%
19%
39%
0%
560%
62%
All nutrients comparison - raw data values
Nutrient
DV% diff.
Vitamin K
224µg
187%
Vitamin C
0mg
20.2mg
22%
Vitamin A
6µg
131µg
14%
Iron
1.14mg
2.14mg
13%
Cholesterol
33mg
0mg
11%
Fiber
2.7g
11%
Vitamin E
1.62mg
11%
Vitamin B6
0.034mg
0.171mg
11%
Calcium
6mg
108mg
10%
Carbs
24.93g
2.85g
7%
Manganese
0.224mg
0.395mg
7%
Copper
0.093mg
0.042mg
6%
Vitamin B12
0.14µg
0µg
6%
Calories
131kcal
22kcal
5%
Potassium
24mg
196mg
5%
Folate
64µg
83µg
5%
Protein
5.15g
3.17g
4%
Vitamin B1
0.209mg
0.162mg
4%
Vitamin B5
0.183mg
0.322mg
3%
Choline
18.3mg
3%
Zinc
0.56mg
0.77mg
2%
Selenium
1µg
2%
Vitamin B2
0.15mg
0.129mg
2%
Polyunsaturated fat
0.429g
0.13g
2%
Fats
1.05g
0.49g
1%
Magnesium
18mg
22mg
1%
Phosphorus
63mg
73mg
1%
Sodium
6mg
33mg
1%
Vitamin B3
0.992mg
1.221mg
1%
Protein per 100 calories
3.9g
14g
N/A
Calories per 10 g protein
254kcal
69kcal
N/A
Weight per 100 calories
76g
455g
N/A
Net carbs
24.93g
0.15g
N/A
Sugar
0.38g
N/A
Saturated fat
0.15g
0.05g
0%
Monounsaturated fat
0.124g
0.026g
0%
Tryptophan
0.065mg
0.043mg
0%
Threonine
0.134mg
0.106mg
0%
Isoleucine
0.197mg
0.104mg
0%
Leucine
0.348mg
0.17mg
0%
Lysine
0.097mg
0.198mg
0%
Methionine
0.079mg
0.048mg
0%
Phenylalanine
0.247mg
0.128mg
0%
Valine
0.217mg
0.153mg
0%
Histidine
0.103mg
0.066mg
0%
Fructose
0.17g
0%
Macronutrient Comparison
Macronutrient breakdown side-by-side comparison
3
5%
25%
69%
Protein:
5.15 g
Fats:
1.05 g
Carbs:
24.93 g
Water:
68.56 g
Other:
0.31 g
2
3%
3%
93%
Protein:
3.17 g
Fats:
0.49 g
Carbs:
2.85 g
Water:
92.55 g
Other:
0.94 g
Contains
more
Protein Protein
+62.5%
Contains
more
Fats Fats
+114.3%
Contains
more
Carbs Carbs
+774.7%
Contains
more
Water Water
+35%
Contains
more
Other Other
+203.2%
Fat Type Comparison
Fat type breakdown side-by-side comparison
2
21%
18%
61%
Saturated fat:
Sat. Fat
0.15 g
Monounsaturated fat:
Mono. Fat
0.124 g
Polyunsaturated fat:
Poly. Fat
0.429 g
1
24%
13%
63%
Saturated fat:
Sat. Fat
0.05 g
Monounsaturated fat:
Mono. Fat
0.026 g
Polyunsaturated fat:
Poly. Fat
0.13 g
Contains
more
Mono. Fat Monounsaturated fat
+376.9%
Contains
more
Poly. Fat Polyunsaturated fat
+230%
Contains
less
Sat. Fat Saturated fat
-66.7%