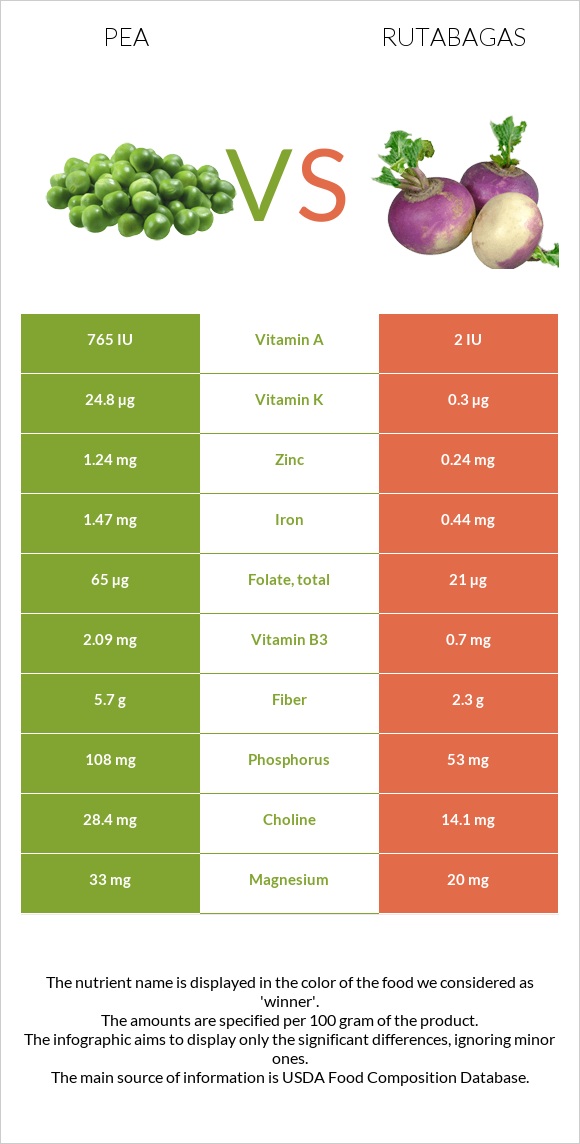
Significant differences between peas and rutabagas Peas have more vitamin B5, vitamin K, manganese, vitamin A, copper, vitamin B1, iron, fiber, and folate; however, rutabagas are richer in vitamin C. Peas cover your daily vitamin B5 needs 3057% more than rutabagas. Rutabagas have 401 times less vitamin A than peas. Peas have 801 IU of vitamin A, while rutabagas have 2 IU. Rutabagas have a higher glycemic index. The glycemic index of rutabagas is 72, while the glycemic index of peas is 54. Specific food types used in this comparison are Peas, green, cooked, boiled, drained, without salt and Rutabagas, raw .
Infographic
Mineral Comparison
Mineral comparison score is based on the number of minerals by which one or the other food is richer. The "coverage" charts below show how much of the daily needs can be covered by 300 grams of the food.
8
100 g
300 g
1 cup - 160g
Magnesium
Magnesium
Calcium
Calcium
Potassium
Potassium
Iron
Iron
Copper
Copper
Zinc
Zinc
Phosphorus
Phosphorus
Sodium
Sodium
Manganese
Manganese
Selenium
Selenium
28%
8.1%
24%
58%
58%
32%
50%
0.39%
68%
10%
2
100 g
300 g
1 cup, cubes - 140g 1 small - 192g 1 medium - 386g 1 large - 772g
Magnesium
Magnesium
Calcium
Calcium
Potassium
Potassium
Iron
Iron
Copper
Copper
Zinc
Zinc
Phosphorus
Phosphorus
Sodium
Sodium
Manganese
Manganese
Selenium
Selenium
14%
13%
27%
17%
11%
6.5%
23%
1.6%
17%
3.8%
Vitamin Comparison
Vitamin comparison score is based on the number of vitamins by which one or the other food is richer. The "coverage" charts below show how much of the daily needs can be covered by 300 grams of the food.
8
100 g
300 g
1 cup - 160g
Vitamin C
Vit. C
Vitamin D
Vit. D
Vitamin A
Vit. A
Vitamin E
Vit. E
Vitamin B1
Vit. B1
Vitamin B2
Vit. B2
Vitamin B3
Vit. B3
Vitamin B5
Vit. B5
Vitamin B6
Vit. B6
Vitamin B12
Vit. B12
Vitamin K
Vit. K
Folate
Folate
47%
0%
13%
2.8%
65%
34%
38%
9180%
50%
0%
65%
47%
2
100 g
300 g
1 cup, cubes - 140g 1 small - 192g 1 medium - 386g 1 large - 772g
Vitamin C
Vit. C
Vitamin D
Vit. D
Vitamin A
Vit. A
Vitamin E
Vit. E
Vitamin B1
Vit. B1
Vitamin B2
Vit. B2
Vitamin B3
Vit. B3
Vitamin B5
Vit. B5
Vitamin B6
Vit. B6
Vitamin B12
Vit. B12
Vitamin K
Vit. K
Folate
Folate
83%
0%
0%
6%
23%
9.2%
13%
9.6%
23%
0%
0.75%
16%
All nutrients comparison - raw data values
Nutrient
DV% diff.
Vitamin B5
153mg
0.16mg
3057%
Vitamin K
25.9µg
0.3µg
21%
Manganese
0.525mg
0.131mg
17%
Copper
0.173mg
0.032mg
16%
Iron
1.54mg
0.44mg
14%
Vitamin B1
0.259mg
0.09mg
14%
Fiber
5.5g
2.3g
13%
Vitamin C
14.2mg
25mg
12%
Folate
63µg
21µg
11%
Protein
5.36g
1.08g
9%
Zinc
1.19mg
0.24mg
9%
Phosphorus
117mg
53mg
9%
Vitamin B6
0.216mg
0.1mg
9%
Vitamin B2
0.149mg
0.04mg
8%
Vitamin B3
2.021mg
0.7mg
8%
Magnesium
39mg
20mg
5%
Vitamin A
40µg
0µg
4%
Choline
29.7mg
14.1mg
3%
Calories
84kcal
37kcal
2%
Carbs
15.63g
8.62g
2%
Calcium
27mg
43mg
2%
Selenium
1.9µg
0.7µg
2%
Fructose
0.41g
1.61g
2%
Potassium
271mg
305mg
1%
Vitamin E
0.14mg
0.3mg
1%
Protein per 100 calories
6.4g
2.9g
N/A
Calories per 10 g protein
157kcal
343kcal
N/A
Weight per 100 calories
119g
270g
N/A
Fats
0.22g
0.16g
0%
Net carbs
10.13g
6.32g
N/A
Sugar
5.93g
4.46g
N/A
Starch
0.4g
0%
Sodium
3mg
12mg
0%
Saturated fat
0.039g
0.027g
0%
Monounsaturated fat
0.019g
0.025g
0%
Polyunsaturated fat
0.102g
0.088g
0%
Tryptophan
0.037mg
0%
Threonine
0.201mg
0%
Isoleucine
0.193mg
0%
Leucine
0.32mg
0%
Lysine
0.314mg
0%
Methionine
0.081mg
0%
Phenylalanine
0.198mg
0%
Valine
0.232mg
0%
Histidine
0.105mg
0%
Macronutrient Comparison
Macronutrient breakdown side-by-side comparison
4
5%
16%
78%
Protein:
5.36 g
Fats:
0.22 g
Carbs:
15.63 g
Water:
77.87 g
Other:
0.92 g
1
9%
89%
Protein:
1.08 g
Fats:
0.16 g
Carbs:
8.62 g
Water:
89.43 g
Other:
0.71 g
Contains
more
Protein Protein
+396.3%
Contains
more
Fats Fats
+37.5%
Contains
more
Carbs Carbs
+81.3%
Contains
more
Other Other
+29.6%
Contains
more
Water Water
+14.8%
Fat Type Comparison
Fat type breakdown side-by-side comparison
1
24%
12%
64%
Saturated fat:
Sat. Fat
0.039 g
Monounsaturated fat:
Mono. Fat
0.019 g
Polyunsaturated fat:
Poly. Fat
0.102 g
2
19%
18%
63%
Saturated fat:
Sat. Fat
0.027 g
Monounsaturated fat:
Mono. Fat
0.025 g
Polyunsaturated fat:
Poly. Fat
0.088 g
Contains
more
Poly. Fat Polyunsaturated fat
+15.9%
Contains
less
Sat. Fat Saturated fat
-30.8%
Contains
more
Mono. Fat Monounsaturated fat
+31.6%
Carbohydrate type comparison
Carbohydrate type breakdown side-by-side comparison
2
88%
2%
7%
3%
Starch:
0 g
Sucrose:
5.22 g
Glucose:
0.13 g
Fructose:
0.41 g
Lactose:
0 g
Maltose:
0.18 g
Galactose:
0 g
3
8%
11%
47%
33%
Starch:
0.4 g
Sucrose:
0.53 g
Glucose:
2.3 g
Fructose:
1.61 g
Lactose:
0 g
Maltose:
0.02 g
Galactose:
0 g
Contains
more
Sucrose Sucrose
+884.9%
Contains
more
Maltose Maltose
+800%
Contains
more
Starch Starch
+∞%
Contains
more
Glucose Glucose
+1669.2%
Contains
more
Fructose Fructose
+292.7%
~equal in
Lactose
~0g
~equal in
Galactose
~0g