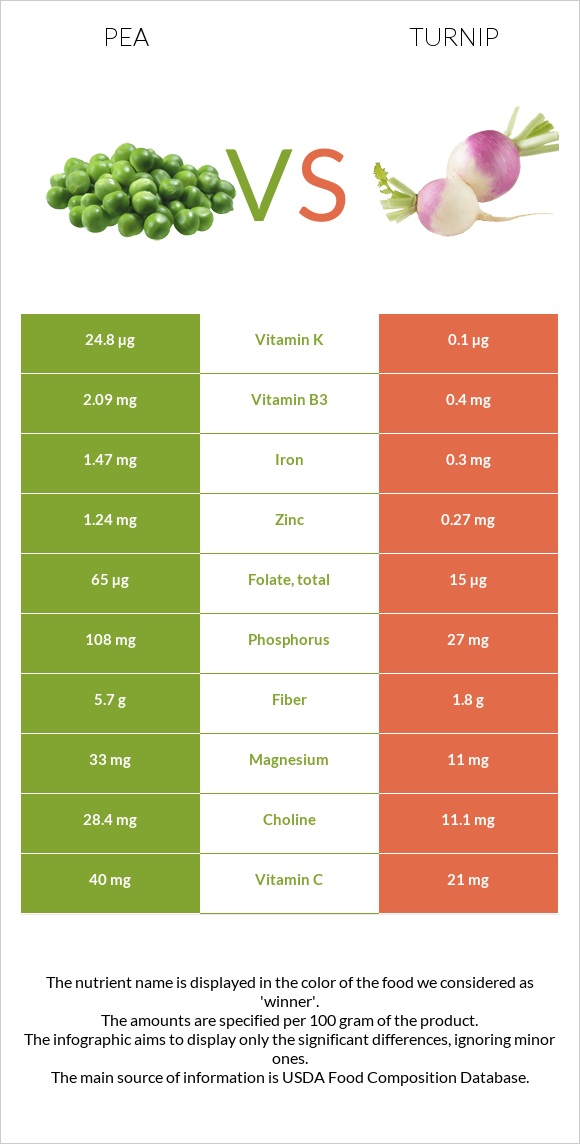
How are peas and turnip different? Peas have more vitamin B5, vitamin K, vitamin B1, manganese, vitamin A, iron, fiber, phosphorus, folate, and vitamin B3 than turnip. Daily need coverage for vitamin B5 for peas is 3056% higher. Peas have a lower glycemic index (54) than turnip (73). Peas, green, cooked, boiled, drained, without salt and Turnips, raw are the varieties used in this article.
Infographic
Mineral Comparison
Mineral comparison score is based on the number of minerals by which one or the other food is richer. The "coverage" charts below show how much of the daily needs can be covered by 300 grams of the food.
9
100 g
300 g
1 cup - 160g
Magnesium
Magnesium
Calcium
Calcium
Potassium
Potassium
Iron
Iron
Copper
Copper
Zinc
Zinc
Phosphorus
Phosphorus
Sodium
Sodium
Manganese
Manganese
Selenium
Selenium
28%
8.1%
24%
58%
58%
32%
50%
0.39%
68%
10%
1
100 g
300 g
1 slice - 15g 1 small - 61g 0.5 cup, cubes - 65g 1 medium - 122g 1 cup, cubes - 130g 1 large - 183g
Magnesium
Magnesium
Calcium
Calcium
Potassium
Potassium
Iron
Iron
Copper
Copper
Zinc
Zinc
Phosphorus
Phosphorus
Sodium
Sodium
Manganese
Manganese
Selenium
Selenium
7.9%
9%
17%
11%
28%
7.4%
12%
8.7%
17%
3.8%
Vitamin Comparison
Vitamin comparison score is based on the number of vitamins by which one or the other food is richer. The "coverage" charts below show how much of the daily needs can be covered by 300 grams of the food.
9
100 g
300 g
1 cup - 160g
Vitamin C
Vit. C
Vitamin D
Vit. D
Vitamin A
Vit. A
Vitamin E
Vit. E
Vitamin B1
Vit. B1
Vitamin B2
Vit. B2
Vitamin B3
Vit. B3
Vitamin B5
Vit. B5
Vitamin B6
Vit. B6
Vitamin B12
Vit. B12
Vitamin K
Vit. K
Folate
Folate
47%
0%
13%
2.8%
65%
34%
38%
9180%
50%
0%
65%
47%
1
100 g
300 g
1 slice - 15g 1 small - 61g 0.5 cup, cubes - 65g 1 medium - 122g 1 cup, cubes - 130g 1 large - 183g
Vitamin C
Vit. C
Vitamin D
Vit. D
Vitamin A
Vit. A
Vitamin E
Vit. E
Vitamin B1
Vit. B1
Vitamin B2
Vit. B2
Vitamin B3
Vit. B3
Vitamin B5
Vit. B5
Vitamin B6
Vit. B6
Vitamin B12
Vit. B12
Vitamin K
Vit. K
Folate
Folate
70%
0%
0%
0.6%
10%
6.9%
7.5%
12%
21%
0%
0.25%
11%
All nutrients comparison - raw data values
Nutrient
DV% diff.
Vitamin B5
153mg
0.2mg
3056%
Vitamin K
25.9µg
0.1µg
22%
Vitamin B1
0.259mg
0.04mg
18%
Manganese
0.525mg
0.134mg
17%
Iron
1.54mg
0.3mg
16%
Fiber
5.5g
1.8g
15%
Phosphorus
117mg
27mg
13%
Folate
63µg
15µg
12%
Copper
0.173mg
0.085mg
10%
Vitamin B3
2.021mg
0.4mg
10%
Vitamin B6
0.216mg
0.09mg
10%
Protein
5.36g
0.9g
9%
Vitamin B2
0.149mg
0.03mg
9%
Vitamin C
14.2mg
21mg
8%
Zinc
1.19mg
0.27mg
8%
Magnesium
39mg
11mg
7%
Vitamin A
40µg
0µg
4%
Calories
84kcal
28kcal
3%
Carbs
15.63g
6.43g
3%
Sodium
3mg
67mg
3%
Choline
29.7mg
11.1mg
3%
Potassium
271mg
191mg
2%
Selenium
1.9µg
0.7µg
2%
Vitamin E
0.14mg
0.03mg
1%
Fructose
0.41g
1%
Protein per 100 calories
6.4g
3.2g
N/A
Calories per 10 g protein
157kcal
311kcal
N/A
Weight per 100 calories
119g
357g
N/A
Fats
0.22g
0.1g
0%
Net carbs
10.13g
4.63g
N/A
Calcium
27mg
30mg
0%
Sugar
5.93g
3.8g
N/A
Saturated fat
0.039g
0.011g
0%
Monounsaturated fat
0.019g
0.006g
0%
Polyunsaturated fat
0.102g
0.053g
0%
Tryptophan
0.037mg
0.009mg
0%
Threonine
0.201mg
0.025mg
0%
Isoleucine
0.193mg
0.036mg
0%
Leucine
0.32mg
0.033mg
0%
Lysine
0.314mg
0.036mg
0%
Methionine
0.081mg
0.011mg
0%
Phenylalanine
0.198mg
0.017mg
0%
Valine
0.232mg
0.03mg
0%
Histidine
0.105mg
0.014mg
0%
Macronutrient Comparison
Macronutrient breakdown side-by-side comparison
4
5%
16%
78%
Protein:
5.36 g
Fats:
0.22 g
Carbs:
15.63 g
Water:
77.87 g
Other:
0.92 g
1
6%
92%
Protein:
0.9 g
Fats:
0.1 g
Carbs:
6.43 g
Water:
91.87 g
Other:
0.7 g
Contains
more
Protein Protein
+495.6%
Contains
more
Fats Fats
+120%
Contains
more
Carbs Carbs
+143.1%
Contains
more
Other Other
+31.4%
Contains
more
Water Water
+18%
Fat Type Comparison
Fat type breakdown side-by-side comparison
2
24%
12%
64%
Saturated fat:
Sat. Fat
0.039 g
Monounsaturated fat:
Mono. Fat
0.019 g
Polyunsaturated fat:
Poly. Fat
0.102 g
1
16%
9%
76%
Saturated fat:
Sat. Fat
0.011 g
Monounsaturated fat:
Mono. Fat
0.006 g
Polyunsaturated fat:
Poly. Fat
0.053 g
Contains
more
Mono. Fat Monounsaturated fat
+216.7%
Contains
more
Poly. Fat Polyunsaturated fat
+92.5%
Contains
less
Sat. Fat Saturated fat
-71.8%