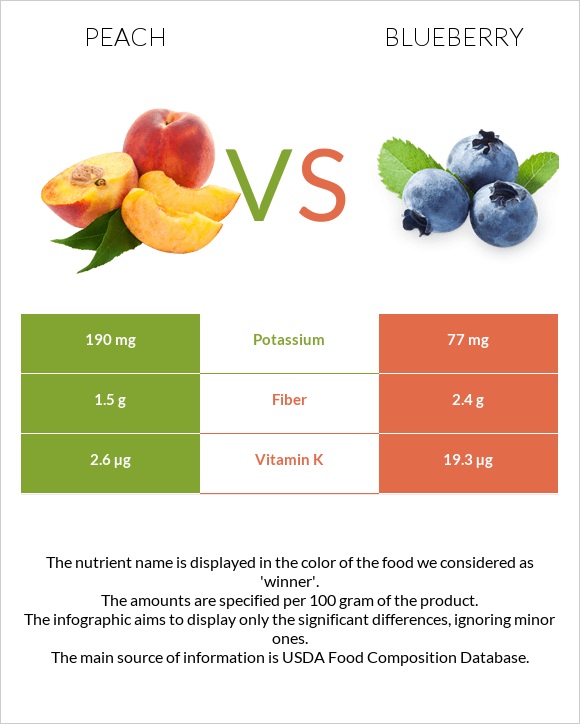
What are the main differences between peach and blueberries? Peach is richer in vitamin A, yet blueberries are richer in vitamin K and manganese. Blueberries' daily need coverage for vitamin K is 14% higher. Peach has 6 times more vitamin A than blueberries. Peach has 326 IU of vitamin A, while blueberries have 54 IU. Peach has a lower glycemic index than blueberries. We used Peaches, yellow, raw and Blueberries, raw types in this comparison.
Infographic
Mineral Comparison
Mineral comparison score is based on the number of minerals by which one or the other food is richer. The "coverage" charts below show how much of the daily needs can be covered by 300 grams of the food.
5
100 g
300 g
1 small (2-1/2" dia) - 130g 1 NLEA serving - 147g 1 medium (2-2/3" dia) - 150g 1 cup slices - 154g 1 large (2-3/4" dia) - 175g 1 extra large (3" dia) - 224g
Magnesium
Magnesium
Calcium
Calcium
Potassium
Potassium
Iron
Iron
Copper
Copper
Zinc
Zinc
Phosphorus
Phosphorus
Sodium
Sodium
Manganese
Manganese
Selenium
Selenium
6.4%
1.8%
17%
9.4%
23%
4.6%
8.6%
0%
8%
0.55%
2
100 g
300 g
50 berries - 68g 1 cup - 148g
Magnesium
Magnesium
Calcium
Calcium
Potassium
Potassium
Iron
Iron
Copper
Copper
Zinc
Zinc
Phosphorus
Phosphorus
Sodium
Sodium
Manganese
Manganese
Selenium
Selenium
4.3%
1.8%
6.8%
11%
19%
4.4%
5.1%
0.13%
44%
0.55%
Vitamin Comparison
Vitamin comparison score is based on the number of vitamins by which one or the other food is richer. The "coverage" charts below show how much of the daily needs can be covered by 300 grams of the food.
4
100 g
300 g
1 small (2-1/2" dia) - 130g 1 NLEA serving - 147g 1 medium (2-2/3" dia) - 150g 1 cup slices - 154g 1 large (2-3/4" dia) - 175g 1 extra large (3" dia) - 224g
Vitamin C
Vit. C
Vitamin D
Vit. D
Vitamin A
Vit. A
Vitamin E
Vit. E
Vitamin B1
Vit. B1
Vitamin B2
Vit. B2
Vitamin B3
Vit. B3
Vitamin B5
Vit. B5
Vitamin B6
Vit. B6
Vitamin B12
Vit. B12
Vitamin K
Vit. K
Folate
Folate
22%
0%
5.3%
15%
6%
7.2%
15%
9.2%
5.8%
0%
6.5%
3%
6
100 g
300 g
50 berries - 68g 1 cup - 148g
Vitamin C
Vit. C
Vitamin D
Vit. D
Vitamin A
Vit. A
Vitamin E
Vit. E
Vitamin B1
Vit. B1
Vitamin B2
Vit. B2
Vitamin B3
Vit. B3
Vitamin B5
Vit. B5
Vitamin B6
Vit. B6
Vitamin B12
Vit. B12
Vitamin K
Vit. K
Folate
Folate
32%
0%
1%
11%
9.3%
9.5%
7.8%
7.4%
12%
0%
48%
4.5%
All nutrients comparison - raw data values
Nutrient
DV% diff.
Vitamin K
2.6µg
19.3µg
14%
Manganese
0.061mg
0.336mg
12%
Fiber
1.5g
2.4g
4%
Fructose
1.53g
4.97g
4%
Vitamin C
6.6mg
9.7mg
3%
Potassium
190mg
77mg
3%
Carbs
9.54g
14.49g
2%
Vitamin B3
0.806mg
0.418mg
2%
Vitamin B6
0.025mg
0.052mg
2%
Calories
39kcal
57kcal
1%
Magnesium
9mg
6mg
1%
Copper
0.068mg
0.057mg
1%
Phosphorus
20mg
12mg
1%
Vitamin A
16µg
3µg
1%
Vitamin E
0.73mg
0.57mg
1%
Vitamin B1
0.024mg
0.037mg
1%
Vitamin B2
0.031mg
0.041mg
1%
Vitamin B5
0.153mg
0.124mg
1%
Folate
4µg
6µg
1%
Protein
0.91g
0.74g
0%
Protein per 100 calories
2.3g
1.3g
N/A
Calories per 10 g protein
429kcal
770kcal
N/A
Weight per 100 calories
256g
175g
N/A
Fats
0.25g
0.33g
0%
Net carbs
8.04g
12.09g
N/A
Calcium
6mg
6mg
0%
Iron
0.25mg
0.28mg
0%
Sugar
8.39g
9.96g
N/A
Zinc
0.17mg
0.16mg
0%
Starch
0g
0.03g
0%
Sodium
0mg
1mg
0%
Selenium
0.1µg
0.1µg
0%
Choline
6.1mg
6mg
0%
Saturated fat
0.019g
0.028g
0%
Monounsaturated fat
0.067g
0.047g
0%
Polyunsaturated fat
0.086g
0.146g
0%
Tryptophan
0.01mg
0.003mg
0%
Threonine
0.016mg
0.02mg
0%
Isoleucine
0.017mg
0.023mg
0%
Leucine
0.027mg
0.044mg
0%
Lysine
0.03mg
0.013mg
0%
Methionine
0.01mg
0.012mg
0%
Phenylalanine
0.019mg
0.026mg
0%
Valine
0.022mg
0.031mg
0%
Histidine
0.013mg
0.011mg
0%
Macronutrient Comparison
Macronutrient breakdown side-by-side comparison
3
10%
89%
Protein:
0.91 g
Fats:
0.25 g
Carbs:
9.54 g
Water:
88.87 g
Other:
0.43 g
2
14%
84%
Protein:
0.74 g
Fats:
0.33 g
Carbs:
14.49 g
Water:
84.21 g
Other:
0.23 g
Contains
more
Protein Protein
+23%
Contains
more
Other Other
+87%
Contains
more
Fats Fats
+32%
Contains
more
Carbs Carbs
+51.9%
Fat Type Comparison
Fat type breakdown side-by-side comparison
2
11%
39%
50%
Saturated fat:
Sat. Fat
0.019 g
Monounsaturated fat:
Mono. Fat
0.067 g
Polyunsaturated fat:
Poly. Fat
0.086 g
1
13%
21%
66%
Saturated fat:
Sat. Fat
0.028 g
Monounsaturated fat:
Mono. Fat
0.047 g
Polyunsaturated fat:
Poly. Fat
0.146 g
Contains
less
Sat. Fat Saturated fat
-32.1%
Contains
more
Mono. Fat Monounsaturated fat
+42.6%
Contains
more
Poly. Fat Polyunsaturated fat
+69.8%
Carbohydrate type comparison
Carbohydrate type breakdown side-by-side comparison
3
57%
23%
18%
Starch:
0 g
Sucrose:
4.76 g
Glucose:
1.95 g
Fructose:
1.53 g
Lactose:
0 g
Maltose:
0.08 g
Galactose:
0.06 g
3
49%
50%
Starch:
0.03 g
Sucrose:
0.11 g
Glucose:
4.88 g
Fructose:
4.97 g
Lactose:
0 g
Maltose:
0 g
Galactose:
0 g
Contains
more
Sucrose Sucrose
+4227.3%
Contains
more
Maltose Maltose
+∞%
Contains
more
Galactose Galactose
+∞%
Contains
more
Starch Starch
+∞%
Contains
more
Glucose Glucose
+150.3%
Contains
more
Fructose Fructose
+224.8%